|
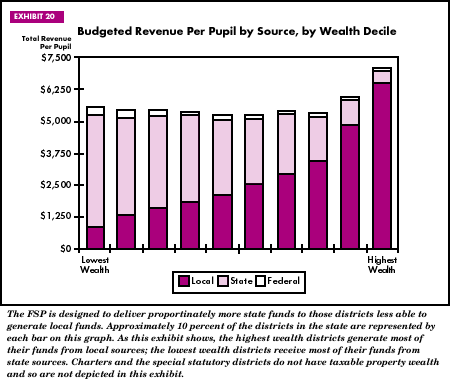
Funding for public education in Texas comes from three major sources: local, state, and federal. Local funding is derived from taxes on district property value. State funding is based on legislative appropriations determined through a finance system defined in statute. Federal funds are appropriated by Congress, generally for specific purposes. State FundsState funds, which account for approximately 41 percent of receipts for public education in Texas, are distributed through a system of formulas known as the Foundation School Program (FSP). A larger proportion of receipts comes from local sources. Not surprisingly, given the variation in other aspects of Texas public education, there is significant variation in the ability of local districts to raise local funds to finance education costs. A multi-decade history of litigation has addressed the appropriate state response to this disparity. In response to the Edgewood v. Kirby litigation filed in 1984, a series of legislative actions to establish a constitutional method for funding Texas public schools evolved. Legal challenges to these solutions--Senate Bill 1019 in 1989, Senate Bill 1 in 1990, Senate Bill 351 in 1991, and Senate Bill 7 in 1993--all resulted in some form of redistribution of public funds for education. Only the last, Senate Bill 7, was declared constitutional by the Texas Supreme Court. The finance system in place in 1997-98 was based on this statute. The FSP uses statutory formulas to determine education costs for each district. The financing of these costs is shared between the state and the local district. A two-tiered system of formulas determines how state funds for public education are to be distributed. Under Senate Bill 7, as in prior legislation, the distribution of state aid to school districts is governed by two basic components; tier 1 state aid, and the guaranteed yield program, known as tier 2. A district's wealth is a key component of the state's financing system because it is a measure of a district's potential to generate revenue locally. Wealth is defined as the district's taxable property value per student. Tier 1 The first tier of the FSP is a financing system comprised of a series of allotments designed to ensure that each school district can provide instructional programs suitable to meet the basic educational needs of its students. For the 1997-98 school year, the basic allotment was $2,396 for each student in average daily attendance (ADA). The basic allotment is adjusted by a cost of education index designed to reflect geographic variations in resource costs across the state that are beyond the control of local school districts. The basic allotment may be further increased by a small district or mid-sized district adjustment. A district receives supplemental funding over and above the adjusted basic allotment for serving students in special instructional programs such as bilingual education, career and technology, and gifted/talented education. Special education and compensatory education allotments are also provided. Allotments are calculated using various student counts. These include both ADA and full-time equivalent (FTE) student counts. In some cases pupil counts are weighted by factors measuring the characteristics of the students. The result of the tier 1 computations is a figure for each district that represents the cost of providing the basic educational services for the students of that district. A fundamental tenet of the financing system is that the state and the school districts will share the cost of this tier. The share for each depends on the property tax base (wealth) of the school district. The wealthier the district, the greater the proportion of the cost that will be the responsibility of the district. Conversely, the poorer the district, the greater the state share. Beginning in 1993-94, districts wishing to participate in the FSP were required to levy a property tax of $0.86 per $100 of valuation as their share of tier 1. Typically, the wealthiest districts are not eligible for any tier 1 state aid, since $0.86 per $100 of their property value can usually generate an amount greater than their total cost of tier 1. In these instances, financing the cost of tier 1 is totally a local responsibility. Tier 2 The guaranteed yield program, begun in 1989-90, provides additional funds to enrich the basic tier 1 program. This level of financing, often called tier 2, enables districts with wealth below $210,000 per weighted student to earn additional state aid by setting their tax rate above the $0.86 minimum level needed for the first tier of the FSP. This program attempts to equalize state and local revenues between the poorest and wealthiest districts. For each penny of tax effort the district levies above the first tier requirement, within a calculated range that may not exceed an additional $0.64, the state will guarantee a yield of $21.00 per penny, per weighted student. The number of pennies for which the state guarantees the $21.00 yield for each year of the biennium is limited to the tax effort each district demonstrated in the second year of the preceding biennium. For example, if a district demonstrated a tax effort of $1.00 in the second year of the preceding biennium, the state would guarantee for each year of the next biennium a maximum yield of $21.00 multiplied by 14 (the difference between $1.00 and $0.86), or $294 per weighted student. For the 1997-98 school year, the tax effort each district demonstrated in 1996-97 was used to determine this limit. The maximum guaranteed yield amount for 1997-98 was $1,344 per weighted student, which is based on the maximum tax effort allowed above the first tier requirement (the additional 64 cents multiplied by the $21.00 yield.) The state's share of tier 1 and tier 2 is financed by the General Revenue Fund and by the per capita apportionment from the Available School Fund (ASF). Constitutionally created in 1876, the ASF consists primarily of earnings from the Permanent School Fund and taxes dedicated to the fund by the state constitution. In 1997-98, the average amount of state aid for each student in ADA was $2,442. The per capita ASF apportionment was $277 per student in ADA, leaving the remaining $2,165 per student to be paid from General Revenue. Constitutionally, all districts, regardless of property wealth, receive the $277 ASF per capita amount. Item 63 in the District Detail shows state aid per student for each district; however, item 63 is divided by the number of students in membership rather than the average daily attendance count. Exhibit 20 below, depicts the inverse relationship between district wealth and state funding. In both the basic allotment (tier 1) and guaranteed yield tier (tier 2) of the FSP, poorer districts receive a larger percentage of their revenue from the state while wealthier districts fund their operations with a greater percentage of local funds.
Exhibit 20 above, further illustrates the relationship between wealth and state aid by highlighting the fact that the local effort of the wealthiest group of districts generates as much revenue as the combined state, local, and federal amounts of the poorer groups. However, the variance among revenue per pupil for the remaining 90 percent of districts is minimized because of the FSP structure. Equalizing Wealth The current financing system establishes an equalized wealth level and requires districts above this level to reduce their wealth by choosing at least one of five options. In 1997-98, the statutory equalized wealth level was $280,000 per weighted student. The 86 districts with wealth greater than this level were directed to choose from among five wealth-reducing options defined in statute. Consistent with the pattern from 1993-94 to date, districts most often select options 3) and 4) from the following list: 1) Voluntary Consolidation. The boards of trustees of two or more districts agree to consolidate. The resulting consolidated district must have wealth less than the equalized wealth cap of $280,000 per weighted student. No districts selected this option in 1997-98. 2) Voluntary Detachment and Annexation of Property. The boards of trustees of two districts agree to detach property from one district and annex it to the other. The resulting wealth of the district detaching property cannot exceed $280,000 per weighted student and the resulting wealth of the district to which the property is annexed cannot exceed $210,000 per weighted student. No districts selected this option in 1997-98. 3) Purchase of Attendance Credits from the State. A district purchases attendance credits to reduce its wealth per weighted student to the equalized wealth level. Each credit corresponds to one student in weighted ADA which is added to the district's own weighted ADA total for the purpose of calculating wealth per weighted student. The cost of a credit is the greater of either the district's total tax revenue per weighted ADA or the state average total tax revenue per weighted ADA for the preceding school year. Money from the payment of credits is deposited for use in financing the FSP. Sixty-six districts chose this option in 1997-98. 4) Education of Students in Other Districts. To reduce its wealth to the equalized level, a district agrees to pay to educate students of another district. The students whose education is paid for are counted for purposes of computing the paying district's wealth per weighted student. The cost of educating each additional student is equal to the cost of attendance credits described in option three. Twenty districts chose this option in 1997-98. 5) Tax Base Consolidation. The boards of trustees of two or more districts agree to conduct an election to create a consolidated taxing district. Under this type of tax base consolidation, all maintenance and operations (M&O) taxing authority resides in the taxing district. Component districts have no M&O taxing authority. No districts chose this option in 1997-98. If no option is exercised by a district above the equalized wealth level, the commissioner of education is directed to detach property and/or consolidate districts to achieve the equalized wealth level. Local FundsLocal funds for public education
are raised primarily through the local property tax. Taxes are levied
against locally assessed property rolls to generate revenue. All tax
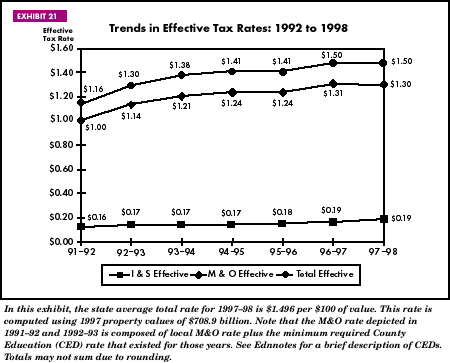
rates shown in this publication are effective, or standardized, Effective tax rates are computed by dividing the money collected from taxation (levies) by the standardized property values. Use of the certified 1997 values results in a total effective rate of $1.496, down slightly from the $1.498 rate reported in the prior year. The comptroller's value for the taxable property of any given district may be higher than, lower than, or the same as that district's locally appraised value. The benefit of the comptroller's values is that all property has been assessed through a uniform system. Locally adopted tax rates, the rates most familiar to taxpayers, are not comparable to one another because they do not control for variation in local appraisal practices and optional exemptions. Districts may set two tax rates each year, one for maintenance and operations (M&O) and, if necessary, another for servicing debt, called the interest and sinking fund rate (I&S). Changes were made affecting tax rate limitations during the 1995 legislative session. Under provisions of Chapter 45 of the Texas Education Code, locally adopted M&O tax rates are generally subject to a statutory maximum of $1.50 per $100 assessed valuation for 1997-98. See Exhibit 21 below.
Under current statute, a district is allowed to set a tax rate that will generate the same amount of maintenance and operations revenue as was generated the prior year. That rate, plus $0.08, becomes the district's rollback tax rate. If a district sets a tax rate above the rollback rate, an election is automatically triggered and the voters decide whether to limit the adopted rate to the rollback rate. The property values shown in this publication are for the 1997 calendar year. For this year, certified taxable property values for the state totaled $708.9 billion, $47.8 billion (7.2 percent) greater than the amount reported for calendar year 1996 ($661.2 billion). Values reported for both 1996 and 1997 take into account the increase in the homestead exemption, made available by constitutional amendment. Property values increased between 1996 and 1997 because of the overall health of the growing Texas economy. Federal FundsAlmost all federal funds are appropriated by Congress for specific programs or specific populations of students, and must be expended for designated purposes. The majority of these federal funds must be spent to supplement programs already in place, not to relieve the state of its financial obligation to provide programs that address the needs of special students. Often, the federal appropriations permit both local and state use of each state's allocation. The portion of the state's allocation to be spent by local school districts is distributed by formula. The remaining allocation is discretionary and may be spent at either the state or local level. Examples of federal sources of funding to school districts are the National School Lunch Program, various special education funds, and the Improving America's Schools Act Title I Program for low-income students. Accounting for the SystemTexas public school districts use a uniform accounting system to record revenues and expenditures. Other entities, such as regional education service centers and county, state, and federal governments also receive and spend funds on behalf of public education in Texas. School district revenues, in combination with the revenues of these other entities, are referred to as total receipts. All expenditures made by local school districts, plus the additional expenditures made by all other entities for public education are referred to as total disbursements. School district financial
data reported in this publication are budgeted amounts, not actual revenues
and expenditures. Actual financial data for 1997-98 are not available
at the time of publication. Between 1996-97 and 1997-98 no significant
changes occurred in the uniform accounting system used by districts
to record revenues and expenditures. Therefore, the financial data reported
for these two years are comparable. Two years ago, in 1996-97, significant
changes were made in the accounting system. For example, some fund categories
ceased to be reported for budgeted amounts. These were the Special Revenue
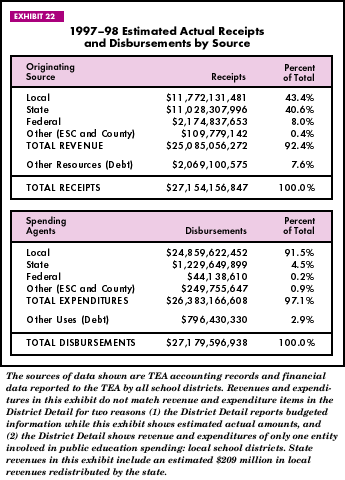
Funds (including shared services arrangements) and the The chart of accounts used by open-enrollment charters is different from that followed by other public school districts. Care should be taken when comparing the financial data for an open-enrollment charter to public school districts. In the District Detail all charters are indicated by an asterisk immediately preceding their name. ReceiptsThe major sources of revenue for public education are the state appropriations to the FSP and the tax revenue generated at the local level by districts. Exhibit 22 below, shows all receipts collected and all disbursements made on behalf of public education, by their source. Receipts equal total revenue from all sources, plus other resources; disbursements equal total expenditures by all spending entities, plus other uses. Other resources and other uses are related to local debt obligations.
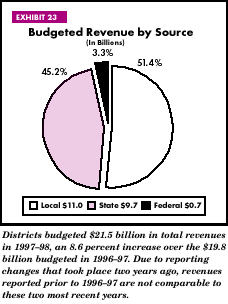
Local revenue, $11.8 billion, represents only those funds received directly by school districts. State revenue, $11.0 billion, includes FSP funding and other items such as textbook purchases and state-matching contributions to the Teacher Retirement System. Beginning with 1993-94, state revenue also includes revenues collected from districts exercising one of the wealth equalizing options. For 1997-98, approximately $209 million was collected through this feature of the FSP. These local tax dollars were redistributed as state aid. Additional revenue sources shown in the exhibit include federal funds and county and education service center contributions. Other resources are composed of the local issuance of debt and income from the sale of assets. Overall, total receipts in 1997-98 increased to $27.2 billion, 7.0 percent more than the amount reported in 1996-97. District Revenues Exhibit 22 above, shows that total revenue from all sources (local, state, federal, and other) totaled $25.1 billion in 1997-98. Of this, the District Detail section of Snapshot shows that only $21.5 billion was budgeted by local school districts. The difference between district budgeted revenues and estimated actual revenue from all sources is $3.6 billion. A portion of this difference can be attributed to revenues for items such as textbook purchases which are not budgeted by local districts. Also, districts do not report budgeted amounts in the Special Revenue Funds (program money from various federal and state sources), yet these funds are included in the estimated actual revenue. Another significant portion of the difference is due to the districts' recurring behavior of under-budgeting the revenues they actually receive. Exhibit 23 below, shows district budgeted revenues by source. Local funds comprise 51.4 percent of total revenues in 1997-98. The vast majority of these local funds, 91.4 percent, are from local property taxes. In any district, the composition and level of revenue sources may vary substantially from the state average depending upon local wealth and qualifications for federal assistance.
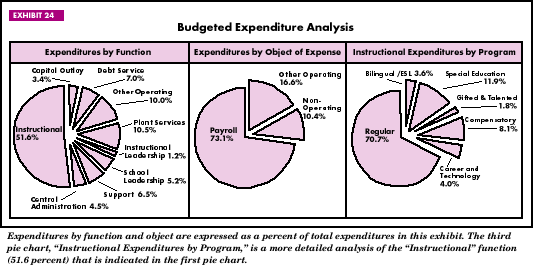
Disbursements Exhibit 22 above, shows 91.5 percent of the disbursements for public school education are made by local school districts. The remaining 8.5 percent are expended directly from other governmental entities such as state, county and federal governments, and ESCs. Examples of state disbursements include expenditures for textbooks, state-administered schools, the Teacher Retirement System, and the TEA. District Expenditures Expenditures are recorded by fund, function, object, and in some cases, by program. Functions describe the broad purposes of expenditures, such as instruction or administration. Object classifications describe the service or item purchased, for example payroll, or supplies and materials. Program classifications are used to identify instructional areas or arrangements, such as the regular, special, career and technology, and bilingual education programs. Exhibit 24 below, shows the distribution of various expenditure categories by function, object, and program. In 1997-98, budgeted expenditures totaled $21.8 billion or $5,597 per pupil.
Expenditures by Function Among the broad purposes for expenditures, instruction accounted for over half (51.6 percent) of all budgeted funds. These costs include all activities dealing directly with the instruction of pupils, including teacher and educational aide salaries, instruction through the use of computers, and classroom equipment purchases. Other major expenditures by function are for supportive services such as administration (central, and school and instructional leadership), 10.9 percent; plant services, 10.5 percent; and support, such as libraries and pupil services, 6.5 percent. See Exhibit C in the Endnotes for a description of the accounting codes used in these categories. Expenditures by Object Object expenditures, or expenditures for services and items, can be divided into operating and non-operating categories. Operating expenditures include all salaries, services, and supplies. Non-operating expenditures include the construction or remodeling of facilities, and the repayment of debt. Payroll, which includes salaries, wages, and employee benefits for school district employees, represents 73.1 percent of all school district expenditures. Other categories by object include professional and contracted services, 7.8 percent, supplies and materials, 6.9 percent, and other operating, 1.9 percent. Debt service and capital outlay, the two non-operating categories, make up the remaining 10.4 percent. As described above, operating expenditures are a subset of total expenditures. They do not include debt service or capital outlay expenses. Because not all districts have debt service obligations, it can be more informative to express categories of expenditures as a percent of the operating budget instead of the combined operating and non-operating budget. For example, payroll (the single largest object category) accounts for 81.5 percent of all operating expenditures. Instruction (the largest function category) accounts for 57.8 percent of all operating expenditures. Expenditures by Program Instructional expenditures (a subset of operating expenditures) are categorized by program. In 1997-98, $11.2 billion was budgeted for instructional expenditures. The majority of these funds, 70.7 percent, is spent on the regular program. The remainder is spent for compensatory education (8.1 percent); special education (11.9 percent); career and technology education (4.0 percent); bilingual education/English as a second language programs (3.6 percent); and gifted and talented education (1.8 percent). ExclusionsSome amounts are excluded from the figures in this document to provide a more equalized financial picture. If these amounts were not omitted, the comparison of one district to another would be distorted or amounts would be double-counted. Statewide, the total excluded for tuition transfers, wealth equalization transfers, and payments to shared services arrangements was approximately $430 million in 1997-98. Discussion of each type of exclusion follows. Tuition Transfers Small districts that do not offer all grades may obtain instructional services from another district for those grade levels. Because the transferring district does not count the enrollment of transferred students, including the expenditure distorts per pupil amounts. Statewide, $8.8 million was budgeted in this category. Wealth Equalization Transfers Wealth Equalization Transfers refer to the amounts budgeted by districts for the cost of reducing their property wealth to the required equalized wealth level. In 1997-98, 86 districts were required to exercise one of the options to reduce their wealth to the equalized level. The budgeted expenditures for all redistribution options are not shown as that would duplicate accounting for these dollars. Statewide, $351.9 million was budgeted in this category in 1997-98. This amount includes local payments between districts as well as dollars redistributed by the state. Payments to Shared Services Arrangements Some districts participate in shared services arrangements (SSAs) with other districts. The fiscal agent or manager of the SSA may be another district, an ESC, or a county. A common type of SSA is designed to share the delivery of special education services among member districts. An indicator is shown in the District Detail for each district that participates in, or is a fiscal agent of, a special education SSA. These districts may have per pupil budgeted amounts that differ from expectations because students served by the fiscal agent or member district are not necessarily enrolled in the district providing the services. To correct for this, any amounts budgeted in the SSA category have been excluded. Budgeted expenditures reported in this category were $69.4 million in 1997-98. Funds Excluded In addition to the exclusions cited above, there is a portion of the financial picture for school districts that cannot be provided in Snapshot. This is because, beginning with 1996-97, districts are not required to report budgeted amounts for two types of funds: the Special Revenue Funds and the Capital Projects Funds. The Special Revenues Funds (codes 200, 300 and 400) are program amounts from various federal and state sources; however, the National School Lunch Funds, which are part of the 200 code series, are still reported and are included. Capital Projects Funds were purposely excluded from previous Snapshot publications to enhance comparability among districts with and without building programs, so omitting them represents no change over previous editions. However, financial resources committed to capital projects and facilities, though not shown in this publication at the district level, can be summarized for the state. In response to increasing enrollments, school districts often increase indebtedness to expand facilities, and as a result, debt service payments rise. For the 1996-97 school year, the most recent year for which actual data are available, total school district debt was estimated to be $11.7 billion, compared to $6.5 billion in 1986-87. Debt in 1996-97 was slightly lower than the $11.8 billion reported in 1995-96; the first decline observed in at least the last 17 years. In 1997-98, school districts planned to spend approximately $1.5 billion to meet their debt service obligations for principal and interest, and anticipated collecting $1.3 billion in debt service tax revenues. The $1.5 billion budgeted for debt service payments represents 7.0 percent of all school district budgeted expenditures. Sixty-one percent of all school districts have debt service payments. Among these districts, the average effective debt service tax rate is $0.21 per $100 of property value. Districts with the highest debt service tax rates are among the poorest in property value per pupil. |

