|
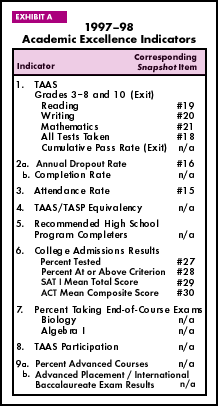
Academic Excellence Indicator System (AEIS): A set of indicators mandated by Texas statute to emphasize student achievement for purposes of accountability as well as recognition. Exhibit A below, lists the 1997-98 indicators and notes the corresponding Snapshot item numbers for the indicators included in this document.
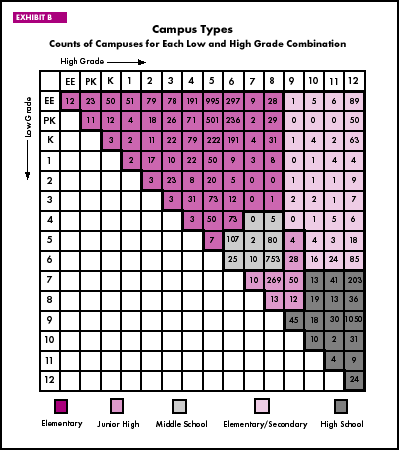
Assessed Valuation: The locally assessed value of property that a district actually taxes. Property values are assessed by county appraisal districts, not the school districts. Assessment practices can vary from district to district; that is, two properties of equal worth may not be appraised at the same value in two different districts. District practices in exempting property from taxation also vary. TEA receives information about locally assessed valuation from the Property Tax Division of the Comptroller's Office of Public Accounts. Available School Fund: The Available School Fund (ASF) was constitutionally created in 1876. It consists primarily of earnings from the Permanent School Fund and taxes dedicated to the fund by the state constitution. Most of the ASF revenue is distributed to local school districts on a per capita basis which is set by the State Board of Education using annual earnings estimates for the fund. The per capita apportionment to school districts in 1997-98 was $277 per ADA. The ASF also pays for school textbooks. Average Daily Attendance (ADA): Student attendance information is reported for the three six-week periods in the fall and the three six-week periods in the spring through the Public Education Information Management System (PEIMS). For each district, full-year ADA is calculated by summing the ADA for each six-week period and dividing by six. Campus Type: Campuses are divided into types according to the range of grades offered as reported to the TEA. The grid in Exhibit B below, shows the possible combinations of low and high grades for each of the campus types. For example, a campus offering a low grade of 7, found along the left edge of the grid, and a high grade of 8, found along the top edge of the grid, is classified as a junior high school. A campus offering only grade 9 (both the low and high grade) is a high school. Counts of the number of schools with each low and high grade combination are shown within the cells of this exhibit.
Comparable Improvement: Comparable Improvement (CI) evaluates how student performance on TAAS reading and mathematics tests has changed (or grown) from one year to the next, and compares that school's growth to the growth of 40 schools demographically similar to the target school. Additional acknowledgment for CI is part of the statewide accountability system and is awarded separately for reading and mathematics. To receive an acknowledgment a school must have a quartile value of Q1, indicating average growth in the top 25 percent of its group; and, it must have at least 50 percent high-performing students. High-performers are matched test takers who received a Texas Learning Index (TLI) score of at least 85 the prior year. Schools are assigned to comparison groups based on student ethnic percentages (African American, Hispanic, and White), economically disadvantaged percent, limited-English proficient percent, and student mobility rate. Only schools can be acknowledged for CI. Districts do not have comparison groups. County Education District: Senate Bill 351, passed in 1991, established a second taxing entity to replace the local district in generating revenue for the portion of the Foundation School Program allocation known as the Local Fund Assignment (LFA). County Education Districts (CEDs) were created to equalize the wide range of district property tax bases for school finance purposes. The 188 CEDs, which included one or more counties, generated and distributed revenue to school districts within each CED. In 1992, CED taxes were deemed to be unconstitutional, but the court allowed the CED taxes to be collected during the 1991-92 and 1992-93 school years. CEDs were dissolved under Senate Bill 7, which went into effect beginning with the 1993-94 school year. Ethnicity: Counts of students and staff are collected by major ethnic group. Counts of student enrollments and staff by ethnic group are derived from the fall 1997 PEIMS collection. These major ethnic groups are African American, Hispanic, White, Asian/Pacific Islander, and Native American. In this publication "other" is presented as the sum of Asian/Pacific Islander and Native American. Expenditure Functions: An expenditure function designates the purposes for which expenditures are made. Function codes used by school districts are outlined in the Financial Accounting & Reporting module of the Financial Accountability System Resource Guide. Functions for which money can be spent are:
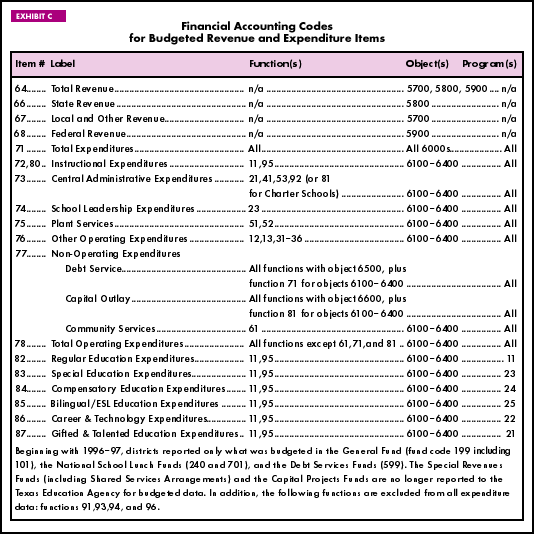
Exhibit C below, lists the function codes included in the revenue and expenditure items found in the District Detail section.
Expenditure Objects: An expenditure object identifies what was purchased. Object codes are outlined in the Financial Accounting & Reporting module of the Financial Accountability System Resource Guide. Objects for which money can be spent are:
Exhibit C above, lists the object codes included in the revenue and expenditure items found in the District Detail section. Full-time Equivalents: All staff counts are shown in terms of full-time equivalents (FTEs), a measure of the extent to which a person occupies a full-time position. For example, a teacher working a full day for the entire school year represents one FTE, a full-time teacher working one semester represents 1 / 2 FTE, and a teacher carrying a half load for the full year represents 1 / 2 FTE. Fractions of FTEs apply to both part-time and full-time staff performing multiple duties. In cases where a person performs multiple tasks, portions of that person's FTE are allocated according to the time spent at each duty. For example, a full-time person employed half the time as a teacher and half as an administrator would be counted as a 0.5 administrator FTE and a 0.5 teacher FTE. Guaranteed Yield: In 1997-98, this component of the Foundation School Program guaranteed districts $21.00 per student, per penny of tax effort levied by the school district. Regardless of the portion of the $21.00 the local district is able to raise through a penny of tax effort, the state will contribute the rest, up to a total of $21.00. Districts able to generate $21.00 per student, per penny of effort on their own receive no state guaranteed yield funds. The guaranteed yield is also referred to as the tier 2 of the Foundation School Program. Local Fund Assignment (LFA): The portion of the Foundation School Program allocation, as determined by state formulas, that is assigned to the district to raise. In 1997-98, an effective tax rate of $0.86 was required of districts wishing to participate in the FSP. While the tax rate for the LFA is fixed for all districts, the dollar amount of the LFA, or local share, varies with the district's property wealth. The poorer the district, the smaller the LFA and the greater the amount of state aid. PEIMS: The Public Education Information Management System is the primary means through which the Texas Education Agency collects information on schools and school district organizations, staff, students, and finances. Staff Categories Defined by Role ID: Staff information from the fall 1997 PEIMS responsibility records was aggregated into categories using the reported role identifiers. Exhibit D below, lists this detail.
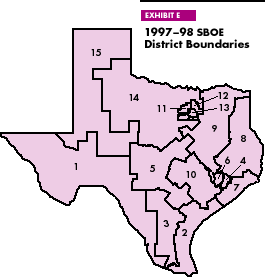
State Board of Education Map of District Boundaries: Exhibit E below, illustrates the 15 SBOE district boundaries. SBOE members and their district numbers are identified in the Letter to the Commissioner, Acknowledgments, & List of SBOE Members page. District numbers identified on that page correspond with the district boundary numbers in the map below.
TAAS/TASP Equivalency: This student performance indicator reflects the percent of graduates who performed well enough on the exit-level TAAS to have a 75 percent likelihood of passing the Texas Academic Skills Program (TASP) test. The TASP is a basic skills test of reading, writing, and mathematics required of all persons entering Texas public institutions of higher education for the first time. To receive an additional acknowledgment on this indicator in the accountability system, schools and districts must have 80.0 percent of all 1997 first-time tested, non-special education graduates meeting or exceeding the TAAS / TASP equivalency standards. Student groups (African American, Hispanic, White, and economically disadvantaged) that meet minimum size requirements must also meet the criterion for a district or school to be acknowledged on this indicator. Tuition Transfers: Small districts that do not offer all grades may obtain instructional services from another district for those grade levels. Because the transferring district does not count the enrollment of transferred students, the inclusion of the tuition transfer expenditure distorts the per pupil amounts. For the years 1992-93 through 1994-95, the TEA did not require districts to report the object code that enabled these budgeted expenditures to be identified. Therefore, tuition transfers were not excluded from expenditures presented in Snapshot for those years. In affected districts, per pupil expenditures may appear to be high as a result, for those years only. |


