Texas Assessment of Academic SkillsThe Texas Assessment of Academic Skills (TAAS) program, begun in 1990-91, emphasizes the assessment of academic skills and focuses on students' higher order thinking and problem-solving skills. The TAAS is a state-administered criterion-referenced test that draws its objectives from the state-mandated curriculum established by the State Board of Education. A major rewrite of the curriculum, the Texas Essential Knowledge and Skills (TEKS), was completed in the summer of 1997 and an assessment based completely on TEKS is planned for future years. Since 1994, the TAAS reading and mathematics assessments have been administered at grades 3-8, and 10 (exit-level) and the writing assessment has been administered at grades 4, 8, and 10. The TAAS program also includes a science and social studies component, given in grade 8. End-of-course examinations are administered to Biology I students in grades 8-12, and Algebra I students in grades 7-12. TAAS results reported here reflect those used in the 1997 statewide accountability system. These are results for all students not served in special education. In addition, an adjustment for mobility is made by including only those examinees enrolled in the district at the end of October of the school year being reported. Generally, results reported are the percent of students passing tests in the subject areas of reading, writing, and mathematics summed across grades 3-8, and 10. Where the reported outcomes are the percent of students passing all tests taken, the results include reading, writing, and mathematics at grades 4, 8, and 10, and reading and mathematics at grades 3, 5, 6, and 7. These TAAS results were reported in the 1997 data tables for accountability, the 1996-97 Academic Excellence Indicator System (AEIS), the 1996-97 School Report Card, and Pocket Edition: 1996-97 Texas Public School Statistics. In all cases, the results for students receiving special education services have been excluded and the adjustment for mobility has been applied. Readers wishing to review TAAS results for all non-special education and special education students tested should request the TEA publication Texas Assessment of Academic Skills: Student Performance Results, 1996-97. During the spring semester of 1997, over 1.5 million students were tested in grades 3-8, and 10. Reading and mathematics tests were given at all these grades. Over 600,000 students took the writing test statewide in grades 4, 8, and 10. Science and social studies tests were administered to over 200,000 students in grade 8. During 1996-97, end-of-course examinations were administered to almost 230,000 Biology I students in grades 8-12, and over 260,000 Algebra I students in grades 7-12. While various measures can be used to interpret test results, this document focuses on the percent passing, computed as the number of students passing a test divided by the number of students taking that test. The percent passing all tests taken is the number of students passing all the tests they attempted, divided by the number of students who were tested. In this report, the "all tests taken" measure includes up to three tests: reading, writing, and mathematics. Note that for grade 8, science and social studies results are excluded from the "all tests taken" calculations reported here. The percent passing can be shown by individual grade, or for all grades tested. "All grades tested" is computed using counts of passers and test takers summed across grades 3-8, and 10. Exhibit 10 below, shows spring 1997 TAAS results by grade and subject. Among the subjects tested, the percent passing is highest for writing, followed by reading and then mathematics. The lowest pass rates for mathematics are in grades 8 (76.3) and 10 (72.6), and for reading in grades 3 (81.5) and 4 (82.5). The highest pass rate for mathematics is in grade 5 (86.2); for reading it is in grade 10 (86.1). Statewide in 1997, 73.2 percent of the students in all grades tested passed all the tests they took. This is an improvement of 6.1 percentage points over the spring of 1996 when 67.1 percent of the students passed all tests taken. It is 17.6 percentage points higher than the spring of 1994 results when 55.6 percent passed all tests taken.
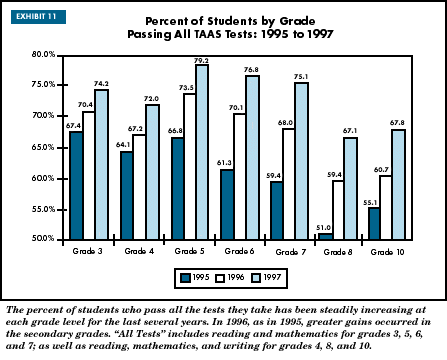
Exhibit 11 shows the percent of students passing all tests taken by grade, for 1995-1997. The percent passing rates show steady improvement in all grades over the past three years. Although grade 8 results have also shown improvement, passing rates for all tests taken have been consistently lowest in this grade for the past three years.
For the third consecutive year, the greatest gains in performance occurred in mathematics. Exhibit 12 below, shows that performance in mathematics improved from 74.2 percent passing in 1996 to 80.1 percent passing in 1997. All student groups improved in this subject, with increases ranging from 3.4 percentage points for "other" (Asian/Pacific Islander and Native American) students, to 9.1 percentage points for African American students. Hispanic students improved on mathematics by 7.9 percentage points; economically disadvantaged students improved by 8.2 percentage points. Writing results increased by 2.4 percentage points over 1996, and reading increased 3.6, from 80.4 percent passing in 1996 to 84.0 percent in 1997. The greatest percentage point gains in writing were made by Hispanic students (3.4) while the greatest gains in reading were achieved by African American students (6.4).
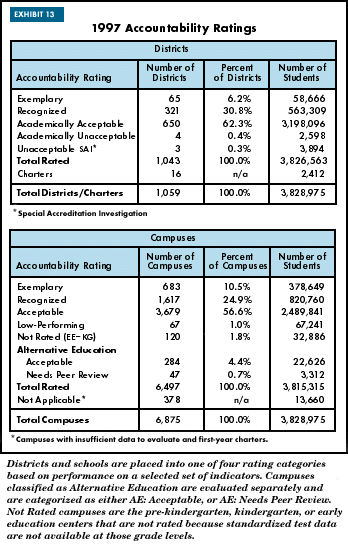
The performance gains achieved by minority students, as shown in Exhibit 12 above, continue to be encouraging. Each year since 1994, the disparities in performance among the major ethnic groups in Texas have narrowed. However, efforts must continue to close these performance gaps. Differences in performance between African American and White students range from 16 percentage points in writing, to 25 percentage points in mathematics. Similar, but smaller, disparities exist between Hispanic students and White students, where the gap ranges from 15 percentage points in writing, to 18 percentage points in mathematics. In 1997, 55.7 percent of African American students and 61.9 percent of Hispanic students passed all tests taken compared with 84.9 percent of White students and 85.6 percent of Asian/Pacific Islander and Native American students. Economically disadvantaged students had passing rates 13 percentage points lower than statewide rates and 23 percentage points lower than passing rates of non-economically disadvantaged students. The statewide accountability system holds districts and campuses responsible for student group performance in order to focus attention on the performance of all students and reduce these disparities. By law, districts must offer remediation to students failing to pass a test in a subject area. Statewide, in grades 3 through 8, and 10, over 412,000 students (27 percent) required remediation after the 1997 TAAS administrations. This figure is lower than the over 487,000 students (33 percent) who required remediation due to failing one or more TAAS tests at grades 3-8, and 10 in 1996. The state compensatory allotment supports this remediation, although it is allocated based on counts of economically disadvantaged students, not the number of students requiring these services. Students failing to pass the exit-level test are not eligible to receive a Texas high school diploma. However, beginning in 1997 local school districts in Texas have the option to offer certificates of completion for these students if they have met all other graduation requirements. Among sophomores taking the March 1997 TAAS exit-level test, over 66,000 (32 percent) failed one or more of the subject areas. These students will have seven more opportunities to master the exit-level TAAS test before the end of their senior year as the class of 1999. Beginning with the class of 1996, a measure of the cumulative pass rate on the exit-level test has been reported in the Academic Excellence Indicator System. Results for the class of 1997 are based on the percent of students who first took the exit-level test in the spring of 1995 and finished testing in the same school district by May 1997. Results for this measure are directly comparable only to the class of 1996 cumulative pass rates reported in last year's edition of Snapshot, and not to the proxy measures reported in previous editions. Statewide results indicate that 26,756 students from the class of 1997 did not pass one or more sections of the exit-level TAAS test. This represents an estimated cumulative passing rate of 87 percent for the class of 1997 and an improvement over the cumulative passing rate of 85 percent for the class of 1996. District-level passing rates for science and social studies are not provided in this publication. Statewide results show that 84.6 percent of 8th grade students passed the science assessment and 67.4 percent passed social studies. Performance patterns among student groups on both these tests were similar to those for reading, writing, and mathematics. For details on the results of these assessments, as well as for the end-of-course examinations in Biology I and Algebra I, see Texas Assessment of Academic Skills: Student Performance Results, 1996-1997. Accountability Rating System for Texas Public SchoolsBeginning in 1994, Texas public schools and school districts have been rated and accredited, respectively, based on a consistent set of mandated indicators. These indicators are performance on the reading, writing, and mathematics portions of the TAAS; dropout rates; and attendance rates. As required by statute, overall performance of all students as well as the performance of student groups (African American, Hispanic, White, and Economically Disadvantaged) are evaluated. Student groups must meet minimum size requirements to be included in the evaluation. In 1997, each district received an accreditation rating of either Exemplary, Recognized, Academically Acceptable, or Academically Unacceptable. Districts may also be rated as Unacceptable: Special Accreditation Investigation, for reasons other than student performance. Schools were rated as Exemplary, Recognized, Acceptable, Low-Performing, Alternative Education: Acceptable, Alternative Education: Needs Peer Review, or Not Rated. Districts and campuses were also evaluated on two measures for which they could receive additional acknowledgment. These measures, which do not affect the rating for a school or district, are the results of college admissions participation and performance, and the percent of students meeting the TAAS/TASP equivalency (See Endnotes for a brief description of this latter measure). Specific details regarding how accountability ratings were calculated are contained in the Accountability Manual: The 1997 Accountability Rating System for Texas Public Schools and School Districts. The distributions of district and school ratings for 1997 are shown in Exhibit 13. Rewards and sanctions are tied to these rating categories.
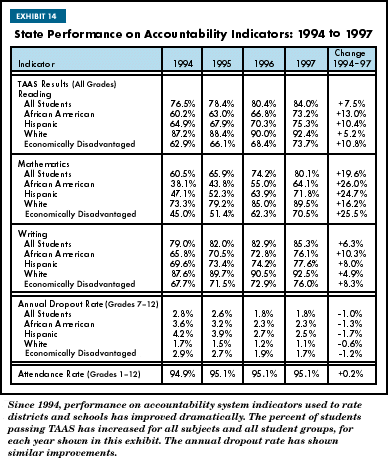
In 1997, 683 schools were rated Exemplary. This is an increase of 289 schools over the number rated Exemplary in 1996. The number of Low-Performing schools decreased from 108 in 1996, to 67 in 1997. Most Low-Performing schools received this rating either because of poor performance on the TAAS mathematics test, or because of a high dropout rate. Exhibit 14 below, shows the changes in performance on the accountability indicators between 1994 to 1997. As shown in the table, performance on the TAAS has risen dramatically, especially among the student groups and particularly in the percent of students passing the mathematics portion of the TAAS. The dropout rate has declined over the same period and the attendance rate has risen slightly during this time. These improvements reflect the efforts of educators, parents, and students statewide to meet the expectations of the accountability system.
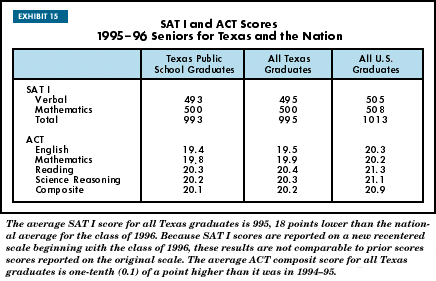
College Admissions TestsIn Texas, almost 65 percent of 1995-96 public high school graduates participated in college admissions testing. Of the class of 1996, over 100,000 took either the SAT I, the ACT, or both tests. The ACT is the ACT Assessment administered by ACT, Inc. The SAT I is the SAT I: Reasoning Test of the College Board's SAT Program. It is a revised but comparable test that was introduced in March 1994 to replace the former Scholastic Aptitude Test. Nationwide, approximately 41 percent of all graduates took the SAT I and 35 percent took the ACT. In Texas, 48 percent of all graduates took the SAT I, and 30 percent took the ACT. For both Texas and the nation, "all graduates" includes public and nonpublic school students. The SAT I consists of verbal and mathematics components. Scores on the verbal and mathematics sections of the SAT I range from 200 to 800 and sum to the SAT I total score, which ranges from 400 to 1600. The ACT includes tests of reading and science reasoning in addition to English and mathematics. Each subject area component of the ACT has a score ranging from 1 to 36--the composite is the average of these four scores. Beginning with the class of 1996, SAT I scores are reported on a recentered scale by the College Board and are reported on the recentered scale in this publication. Thus, SAT I scores reported in earlier editions, because they are based on the original scale, cannot be directly compared to class of 1996 scores that appear in this publication and elsewhere. Exhibit 15 below, shows the average SAT I and ACT scores for all graduates for Texas and the nation. In addition, the averages for just the public school graduates in Texas are shown. Average college admissions scores for all Texas graduates for the class of 1996 were below the national averages. Texas' SAT I total scores were 18 points lower than the national average (995 versus 1013). The ACT composite was 20.2 for all Texas graduates compared to 20.9 for the nation. Scores for public school graduates were slightly lower than those for all Texas graduates-two points lower on the SAT I total, and 0.1 lower on the ACT composite.
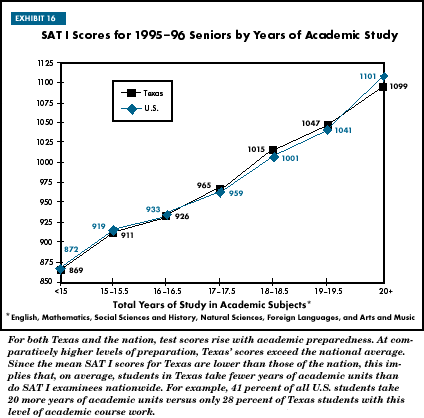
Despite the almost 35 percent increase in the number of students taking the ACT assessment in Texas public and nonpublic schools since 1987, the average ACT composite score on this test has risen six-tenths (0.6) of a point over the same period of time. While the national average ACT composite score for all graduates increased by 0.1 point from 1994-95, the Texas average also went up by 0.1 point. Students who take the SAT I report information on their academic preparedness, parental education, and family income. Students' SAT I scores tend to rise with increasing numbers of academic courses completed, higher levels of parental education, and higher levels of family income. Exhibit 16, shows the relationship between years of study in academic subjects and SAT I total scores.
Similar relationships exist with ACT test score results. The average ACT composite score for Texas students who took a college preparatory high school program, defined as four years of English and three years each of mathematics, social studies, and natural sciences, is 21.2, which is 3.2 points higher than the average score for students who did not complete such a program. Lower levels of academic preparedness offer one possible explanation for the lower SAT I and ACT test scores of African American and Hispanic students relative to scores of White students. Typically, Texas SAT I and ACT results show that African American and Hispanic students complete fewer academic courses compared to White and Asian/Pacific Islander students. An additional data element derived from the college admissions testing program is the percentage of public school examinees scoring at or above the accountability criterion score (1110 on the SAT I; 24 on the ACT). (Note that in previous years this measure was defined as the percentage of graduates scoring at or above the criterion.) This newly defined standard of excellence was met or exceeded by 26.3 percent of the class of 1996. |
Text & Exhibits | Snapshot '97 | Snapshot | Performance Reporting | TEA Home Page

