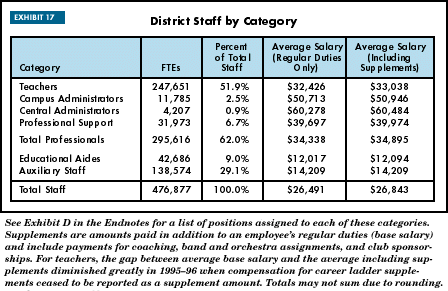
Staff CountsTeachersTeachers are the largest single category of staff, accounting for 84 percent of the professional staff and 52 percent of the total staff. See Exhibit 17 below. Teacher FTE counts increased by 3.0 percent, compared with a student enrollment increase of 2.4 percent from the previous year. Student growth rates vary across districts and grades, requiring districts at times to hire additional teachers for less than full classrooms. Statewide, a new teacher FTE is added for approximately every 12 new students.
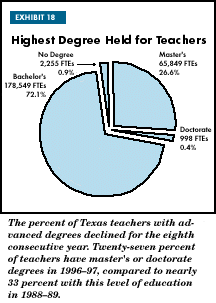
Rates of teacher increases vary with the size of the district. Districts in all size categories, except the very largest and the smallest, hired teachers at a rate greater than their respective average enrollment growth rates, thereby reducing their average student/teacher ratios. The nine districts with enrollments greater than 50,000 hired new teachers at the lowest rate, one new teacher for every 23 new students. Districts with enrollment between 1,000 and 1,600 hired new teachers at the highest rate, one for every 6.7 new students. Support and Administrative StaffThe combined categories of administrators and professional support staff increased by 4.6 percent between 1995-96 and 1996-97, a rate higher than the 3.0 percent rate of growth demonstrated by teachers. Professional support staff increased by 5.6 percent. Campus administrative staff grew by 3.6 percent and central administrative staff increased by the smallest rate, 0.4 percent. In the 216 districts with 1,600 to 5,000 students, professional support staff personnel increased at a rate less than the corresponding growth in enrollment within those districts. Districts with under 500 students experienced the largest growth rate in professional support staff, although this equated to less than one full-time equivalent (FTE) professional support person per district. The nine largest districts experienced the second highest growth rate, averaging 64 new professional support FTEs per district. Central administrative growth rates exceeded enrollment growth rates in only three of the nine district size categories, with the greatest growth occurring in the group of 82 districts with enrollment between 3,000 and 5,000 students. Campus administrative growth rates exceeded enrollment growth rates in all district size categories, except those districts with enrollment between 1,600 and 3,000 students. Nonprofessional StaffThe number of educational aides decreased by 0.8 percent this year, down from last year's 4.2 percent increase. In 1996-97, aides employed at middle schools increased by 3.0 percent over the previous year, while aides employed by junior high schools declined by over 3.3 percent. A small portion of the staff employed as educational aides will advance to teaching positions. During 1996-97, approximately 2,349 teachers (less than one percent of the total teaching staff) had been employed as aides sometime between 1993 and 1996. Auxiliary staff, the second largest category of staff at 29.1 percent of all staff, increased by 4.5 percent. Auxiliary staff include secretaries, bus drivers, maintenance workers, and cafeteria workers. The largest increases occurred in the nine largest districts. The ethnic composition of district staff changed only slightly from the previous school year. Minority staff increased by one-half percent to 35.4 percent of all staff employed in Texas public schools. This is disaggregated to 23.5 percent Hispanic, 11.0 percent African American, and 0.9 percent Asian/Pacific Islander and Native American. Among teachers, approximately 24.4 percent are minorities, representing no significant change from the previous academic year. Although slight percentage increases were observed in most minority groups, ethnic minority recruitment into education careers merits continued emphasis. Teacher ExperienceTeachers employed in Texas in 1996-97 averaged 11.7 years of total experience. Nearly 20 percent of all teachers have more than 20 years experience and 44 percent have between 1 and 10 years of experience. In 1996-97, new teachers accounted for 6.6 percent of the total, a slight increase from the previous year. Teachers at high schools continue to be more experienced--12.8 years on average--compared with elementary school teachers with an average of 11.5 years of experience. The lowest average years of teacher experience exists in junior high schools--10.7 years. Districts with greater enrollment growth continue to have lower average teacher experience, indicating that new, rather than experienced, teachers are more often hired to meet the increase in demand. Teacher CredentialsTo teach in public schools in Texas, individuals must earn appropriate certification by satisfying a combination of education, experience, and test requirements that vary depending upon the certification route pursued. Information about teacher certification, testing requirements, and the Alternative Certification Program (ACP) is available from the State Board for Educator Certification. This agency, created in 1995 by the 74th Texas Legislature, oversees the 250,000 practicing educators across the state and is responsible for all functions related to the preparation, assessment, certification, continuing education, and investigation and sanctioning of education professionals. EducationAs shown in Exhibit 18 below, the majority of teachers in Texas (72.1 percent) hold a bachelor's degree. An additional 27 percent have earned master's or doctoral degrees. Larger districts continue to employ a larger proportion of teachers with advanced degrees. Thirty-two percent of the teachers in the nine largest districts have master's degrees or higher, compared with 18.8 percent of teachers in the smallest districts. The percentage of Texas teachers with advanced degrees continues to decrease. Since 1988-89, this percentage has declined from 32.7 to 27.0. The decline for 1996-97 was three-tenths of a percent. Approximately 52 percent of the teachers with advanced degrees are employed in the 71 urban and major suburban districts; 48 percent work in the 988 remaining school districts.
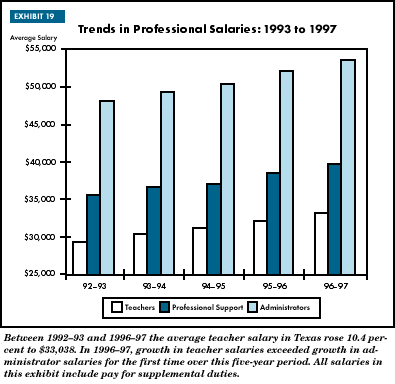
Permits Educators who have not yet earned the appropriate certification may be granted one of five types of permits in order to perform their assigned duties: nonrenewable, temporary classroom assignment, temporary exemption, emergency, and district teaching. Each of these permits allows a person to be employed in the public school system for varying lengths of time. All but the district teaching permit are for individuals who seek to achieve the appropriate certification but are currently deficient in some credential. The district teaching permit, which must be approved by the commissioner of education, is for degreed individuals who do not hold any type of teaching credential. The district teaching permit remains valid as long as the individual is employed in the district. Statewide, 3.9 percent of teachers hold an active permit of some type. The percentage of teachers holding permits varies by subject area and student population served. Excluding the area of regular education, the three areas with the greatest proportion of teachers holding permits are English as a second language (ESL), bilingual education, and special education. The US Department of Education currently includes bilingual/ESL and special education among the designated teacher shortage areas in Texas. Other shortage areas are science, mathematics, and foreign language. Teachers in these areas are eligible for loan deferments or a reduction in the length of their teaching obligation under federal loan and scholarship programs. Professional SalariesTeacher SalariesIn 1996-97, average teacher base salaries increased by 3.3 percent to $32,426. Total average teacher salaries, including reported supplements, climbed to $33,038, a 3.2 percent increase. "Total salaries" refers to pay for regular duties plus any supplemental pay employees earn for additional duties such as coaching, club sponsorships, and band or orchestra assignments. Base pay for regular duties includes local enrichment amounts districts may pay above the minimum salaries specified in statute. Most of the employees who earn supplemental pay are teachers. In the past, the difference between the teacher average total pay and base pay was much greater than it is now. Average total teacher pay was $1,771 greater than average base pay in 1994-95. This difference was due primarily to supplemental pay for teachers who were on the teacher career ladder. With the end of the teacher career ladder allotment, pay previously reported as supplemental became a part of a teacher's base pay amount. This explains the resulting significant increase in average base pay that took place between 1994-95 and 1995-96. In 1996-97, the gap between teacher average total pay and average base pay was $612. A minimum salary schedule for classroom teachers and full-time librarians is specified in statute. This schedule requires that minimum salaries rise as the years of experience of the employee increase. In 1996-97, the minimums required ranged from $1,995 per month for those with no experience to $3,551 per month for those with 20 or more years of service. National ComparisonsAccording to the 1997 Digest of Education Statistics, Texas average teacher salaries ranked 36th among the states in 1996-97. The average salary for Texas teachers was 14.8 percent below the national average of $38,623. However, the salary that Texas teachers earn is closely linked to their years of teaching experience. Because the average experience level of teachers varies from state to state, average salaries are likely to be higher in states with more experienced teachers. In addition to differences in teacher experience among states, cost-of-living differences explain some of the national variation. According to the American Federation of Teachers, in 1995-96, the most recent year available, Texas ranked 36th in teacher salaries. However, when cost-of-living was considered, Texas moved to the 29th rank. As reported in the 1997 Digest of Education Statistics, the pupil-teacher ratio in Texas remains lower than the national average: 15.6 compared with 17.3 nationally in 1995-96. Texas statute mandates a maximum class size of 22 to 1 in kindergarten through grade 4. The expense of maintaining smaller class sizes appears to limit the ability of Texas districts to compensate teachers with higher salaries. Of the 35 states with salaries higher than those in Texas, 22 (61 percent) also had higher pupil-teacher ratios in 1995-96. Salaries by District TypeAnalysis of teacher salaries by size and type of district indicate the greatest increase in teacher salaries occurred in districts with enrollment less than 5,000 students. Teacher base salaries in the larger districts grew at rates less than the state average. Though the rate of salary increase was greater in much smaller districts, major urban districts still pay teachers more on average than do rural districts. In 1996-97, teacher salaries in urban districts were 11.8 percent higher than in rural districts. Cost-of-living differences between urban and rural areas explain some of this variation. Districts classified as non-metro fast growing pay the least among all district types, perhaps because they have the least experienced teachers on average. Other Staff SalariesCentral and campus administrator base salaries exhibited a 2.9 percent increase in 1996-97, while professional support staff salaries increased by 3.8 percent. Including supplements, central administrators earn an average of $60,484, campus administrators $50,946, and professional support staff $39,974. Overall, the combined base salaries for all categories of professional staff (teachers, professional support, and administrators) increased by 3.3 percent, to $34,338, from the 1995-96 school year. Total salaries, including reported supplements, climbed to $34,895, also a 3.3 percent increase. Exhibit 19, depicts trends in professional salaries by category of staff since 1992-93.
|
![]()
![]()
Text & Exhibits | Snapshot '97 | Snapshot | Performance Reporting | TEA Home Page