_Section III - The Basics: Determining a Rating_ |
The previous two sections described the base indicators and the additional features of the system (Required Improvement and the Exceptions Provision). This section describes how to use the indicator data results with the additional features to determine campus and district ratings. The ratings for the overwhelming majority of campuses and districts can be determined this way. Some campuses and districts must be evaluated using different procedures. See Section VI - Special Issues and Circumstances for details about which campuses and districts are affected and how they are evaluated.
The state accountability system is required to rate all districts and campuses that serve students in grades 1 through 12. The first step is to identify the universe of districts and campuses that can be considered for a rating. For 2004, the universe is determined to be those districts and campuses that reported students in membership in any grades (early education through grade 12) in the fall of the 2003-04 school year. Most districts and campuses identified to be in the universe receive a standard rating label (Exemplary, Recognized, Academically Acceptable, or Academically Unacceptable). Some receive a label of Not Rated. Rating labels and their uses are described below.
Once the universe is established, the next step is to determine if the district or campus has TAKS results on which it can be evaluated. In order to attain one of the standard rating labels, districts and campuses must have at least one TAKS test result in the accountability subset. An effort is made through the pairing process to supply TAKS results to regular campuses (with any grades from 1 to 12) with no students in the grades tested so that they can also be evaluated. For more information on pairing see Section VI - Special Issues and Circumstances.
Districts and campuses that have only SDAA results, only completion rates, only dropout rates, or only combinations of these three will not receive a standard rating in 2004. To be eligible for a standard rating, TAKS results are required and only TAKS results are required. Districts and campuses need not have data for the SDAA, dropout, or completion indicators in order to receive a standard rating. Furthermore, performance on any one of the TAKS subjects is sufficient for a rating to be assigned (science, mathematics, reading/ELA, writing, or social studies).
Though at least one TAKS tester (in the accountability subset) is required to be considered for a rating, some places with very small numbers of total TAKS test results may ultimately receive a Not Rated label. The process of Special Analysis is employed when there are very small numbers of total test takers to determine if a rating is appropriate. See Section VI - Special Issues and Circumstances for details about Special Analysis.
Rating labels for districts are specified in statute. In 2004, campuses are assigned the same rating labels as districts rather than having slight differences as existed under the previous system. Thus, the campus rating label Low Performing is replaced with Academically Unacceptable.
For 2004, campuses and districts will be assigned one of the following rating labels.
| District/Charter Use | Campus Use | |
| Exemplary | Used for districts/charters with at least one TAKS test result (in any subject) in the accountability subset. Small numbers subject to Special Analysis. | Used for campuses (regular and charter) serving grades 1-12 and with at least one TAKS test result (in any subject) in the accountability subset. Includes regular campuses with TAKS data due to pairing. Small numbers subject to Special Analysis. |
| Recognized | ||
| Academically Acceptable | ||
| Academically Unacceptable | ||
| Not Rated: Alternative Education | For 2004 only, used for charters that operate one or more registered alternative education campuses. Regular school districts will not receive this rating label. | For 2004 only, used for registered alternative education campuses (regular and charter). |
| Although registered alternative education campuses and charters will not be rated in 2004 based on academic performance, the commissioner of education has the authority to assign an Academically Unacceptable rating to address problems identified through Accountability System Safeguards, Performance-Based Monitoring, or other monitoring and compliance investigations. | ||
| Not Rated: Other | Used for charters if they are new and would otherwise be rated Academically Unacceptable. Used for districts/charters in the unlikely event that there is insufficient data to rate due to no TAKS results in the accountability subset. |
Used if the campus (regular or charter):
|
| Not Rated: Data Integrity Issues | Used in the rare situation where the accuracy and/or integrity of performance results are compromised and it is not possible to assign a standard rating label based on the evaluation of performance. This label may be assigned temporarily at the time of the initial ratings release pending an on-site investigation or may be assigned as the final rating label for the year. This rating label is not equivalent to an Academically Unacceptable rating. The commissioner of education also has the authority to lower a standard rating or assign an Academically Unacceptable rating to address problems with the accuracy and/or integrity of performance results that are discovered through Accountability System Safeguards, Performance-Based Monitoring, or other monitoring and compliance reviews. See Section V - Responsibilities and Consequences for more information about the circumstances that trigger this rating label. If any campus within a district receives a rating of Not Rated: Data Integrity Issues, then the district's rating will also be Not Rated: Data Integrity Issues. However, it is possible for a district rating to be Not Rated: Data Integrity Issues without any of its campuses having that rating label. |
|
Annual accountability ratings are finalized when the accountability appeals process for the year is completed in the fall following release of the ratings.
The state accountability rating and the AYP status will be aligned in 2004 in that the labels for the two systems will be conjoined. For example, an Academically Acceptable district that also Meets AYP, will receive a label of Academically Acceptable, Meets AYP. See Section VII - AYP and the Accountability System for details about the relationship between the AYP and state accountability systems.
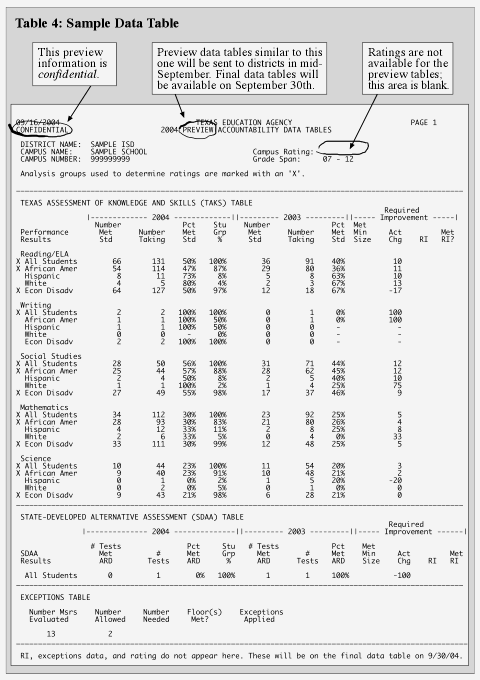
In mid-September, prior to finalizing all computations necessary for accountability ratings, TEA will send districts preview data tables for the district and each campus.
These tables will not show a rating and will not provide calculations for Required Improvement or the Exceptions Provision. However, using the data on the tables and the 2004 Accountability Manual, districts can predict their ratings in advance of the TEA ratings release. These preview data tables will contain unmasked data and must be treated as confidential. That is, information that reveals the performance of an individual student may be shown.
A sample unmasked preview data table for a campus serving grades 7-12 is on the following pages. While not a common configuration, this grade span includes data for all accountability indicators.

(For a clearer view of this page, download page 30, a pdf.)
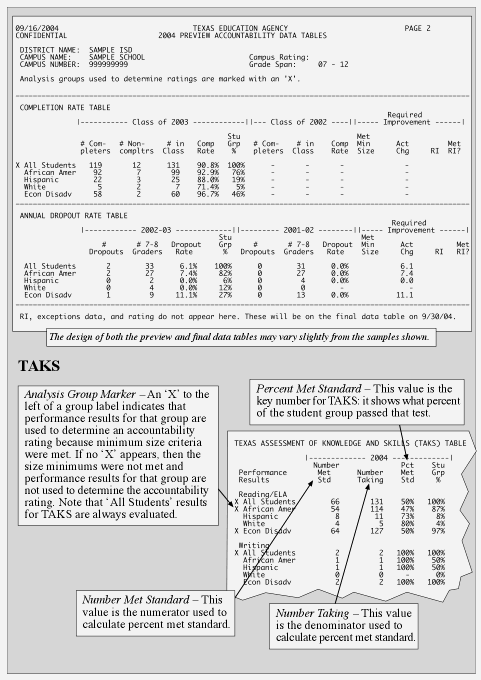
(For a clearer view of this page, download page 31, a pdf.)
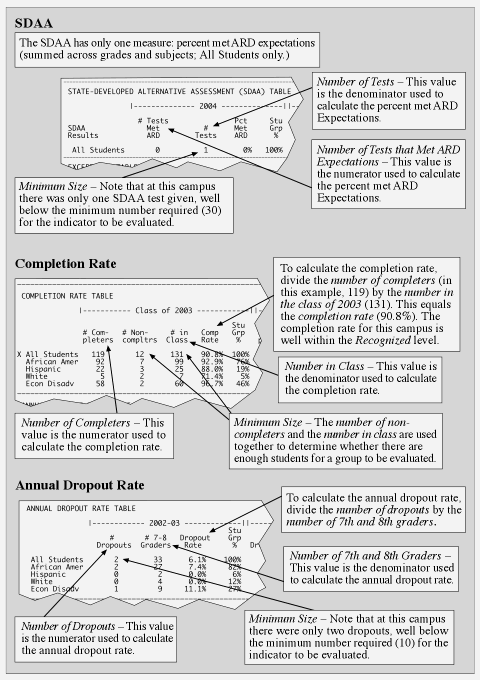
(For a clearer view of this page, download page 32, a pdf.)
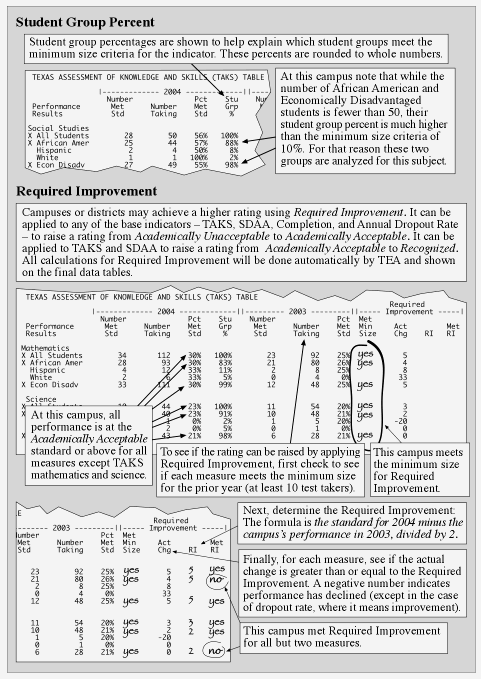
(For a clearer view of this page, download page 33, a pdf.)
(For a clearer view of this page, download page 34, a pdf.)
The sample shown is of a preview data table. These will be mailed to districts prior to finalizing accountability ratings, for use in verifying their early calculations. Ratings will be released on September 30, 2004. Copies of the final data tables will not be mailed to districts; rather, lists of ratings will be distributed by the ESCs and masked data tables will be put online and made available to districts and the public. See Section IX - Calendar for other important dates.
The following items will appear on the final data tables:
Accountability Ratings. (A list of possible rating labels is shown in Table 3 in this section.)
Pairing. Any regular campus with enrollment within grades 1-12, but no students tested on TAKS will be paired for accountability. A message will indicate the campus it is paired with.
Messages. These messages appear in the top section of the data table when applicable:
- (Special Analysis Used) (campus or district)
- Rating changed due to appeal. Data not modified. (campus or district)
- This campus is an open-enrollment charter campus. (campus only)
- This campus is not rated due to grade span. (campus only)
- This is a registered alternative education campus. (campus only)
- This is an alternative education open-enrollment charter. (district only)
- District has one or more campuses rated Academically Unacceptable. (district only)
- District exceeds threshold for underreported students. (district only)
- Rating assigned due to data integrity issues, not data shown in this table. (campus or district)
Required Improvement. The final data table shows all calculations for Required Improvement:
- Met Min Size - Met Minimum Size shows "yes" or "no."
- RI - This shows the amount of change needed for Required Improvement to be met.
- Met RI - If Required Improvement is calculated, this shows "yes" or "no" depending on the comparison of actual change to the change needed (RI).
- Blank - If Required Improvement is not applicable, the columns are blank.
Footnotes. A footnote appears if the Required Improvement floor of 65% is not met thus preventing the use of Required Improvement to change a rating from Academically Acceptable to Recognized.
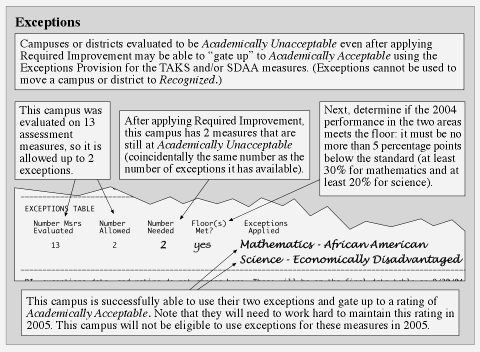
Exceptions. The final data table shows all calculations for the Exceptions Provision:
- Number Needed - This shows the number of assessment measures below the Academically Acceptable standard that did not meet Required Improvement.
- Floor Met? - This shows "yes" or "no" depending on whether or not the performance floor was met for all the assessment measures needing exception. If any don't meet the floor, "no" appears.
- Exceptions Applied - This shows the subject and group for which an exception is used. Up to three may be listed.
- Blank - If the Exceptions Provision is not applicable, the columns are blank.
Masked Data
As in the past, performance on the data tables posted to the agency website is masked when there are fewer than five students in the denominator of the measure. Additionally, for the first time this year, all performance at or near 0% or 100% is also masked. It is necessary to mask data that potentially reveals the performance of every student in order to be in compliance with the federal Family Educational Rights and Privacy Act (FERPA).
Two tables follow that summarize the 2004 system. Table 5 provides an overview of the requirements for achieving each rating level. A district or campus must meet the criteria for every applicable measure to be rated Exemplary, Recognized, or Academically Acceptable. If the criteria for a rating are not met for every measure, then the next lower rating is assigned.
For example, to be Academically Acceptable, a campus or district must satisfy all requirements shown in the Academically Acceptable column for each indicator evaluated. As shown, districts and campuses can meet the criteria for the Academically Acceptable rating by meeting either an absolute performance standard or Required Improvement for the base indicators.
In contrast, the Recognized column shows that Required Improvement is not an option for achieving Recognized status for either the dropout rate or completion rate indicators-the absolute Recognized standards must be met for these indicators. The table also shows that the Exceptions Provision only applies to the Academically Acceptable rating.
Districts must meet two additional provisions at the Recognized and Exemplary rating levels: Checks for Academically Unacceptable campuses and excessive underreported students.
In Table 6, a single-page overview provides details of the 2004 system, with the base indicators listed as columns. For example, for each of the indicators, users of this table can see brief definitions, the rounding methodology, the accountability subset methodology, the standards, minimum size criteria, subjects and student groups used, application of Required Improvement, and the Exceptions Provision.
| Academically Acceptable | Recognized | Exemplary | |
| Assessment Indicators | |||
| Spring 2004 TAKS All students and each student group that meets minimum size criteria: - African American |
meet passing standard for each subject:
OR meet Required Improvement |
meet 70% passing standard for each subject OR meet 65% passing standard and meet Required Improvement |
meet 90% passing standard for each subject |
| Spring 2004 SDAA All students if meet minimum size criteria |
meet 50% passing standard (Met ARD Expectations) for single indicator OR meet Required Improvement |
meet 70% passing standard (Met ARD Expectations) for single indicator OR meet 65% passing standard and meet Required Improvement |
meet 90% passing standard (Met ARD Expectations) for single indicator |
| Completion & Dropout Indicators |
|||
| Completion
Rate All students and each student group that meets minimum size criteria: - African American |
meet 75.0% completion rate standard OR meet Required Improvement
|
meet 85.0% completion rate standard
|
meet 95.0% completion rate standard
|
| Annual
Dropout Rate All students and each student group that meets minimum size criteria: - African American |
meet 2.0% dropout rate standard OR meet Required Improvement |
meet 0.7% dropout rate standard |
meet 0.2% dropout rate standard |
| Additional Provisions |
|||
| Exceptions Provision (variable): This provision may be applied if the district or campus would be Academically Unacceptable solely due to not meeting the Academically Acceptable criteria on up to 3 assessment measures. Additional conditions must be met. | Check for Academically Unacceptable Campuses: A district that has one or more campuses rated Academically Unacceptable cannot receive a rating of Exemplary or Recognized. Underreported Students: A district that fails to meet accountability standards for underreported students cannot receive a rating of Exemplary or Recognized. 2004 standards are: no more than 500 underreported students and no more than 5.0% underreported students. |
||
| TAKS | SDAA | Completion Rate | Dropout Rate | |
| Definition | The TAKS results (gr. 3-11) summed across grades by subject. Reading & ELA results are combined. 1st and 2nd administration results of gr. 3 reading are combined. Student passing standard is 1 SEM for gr. 3-10; 2 SEM for gr. 11. | A single (gr. 3-8) indicator calculated as the number of tests meeting ARD expectations (summed across grades & subjects) divided by the number of SDAA tests. | Graduates, GED recipients, and continuers expressed as a % of total students in the class. Campuses serving any of gr. 9-12 w/out a completion rate are assigned the district completion rate. | Gr. 7 and 8 official dropouts as a percent of total gr. 7 and 8 students who were in attendance at any time during the school year. |
| Rounding | Whole Numbers |
Whole Numbers | One decimal | One decimal |
| Standards - Exemplary |
Exemplary: All Subjects ≥ 90% Recognized: All Subjects ≥ 70% Acceptable:
|
Exemplary: ≥ 90% Recognized: ≥ 70% Acceptable: ≥ 50% |
Exemplary: ≥ 95.0% Recognized: ≥ 85.0% Acceptable: ≥ 75.0% |
Exemplary: ≤ 0.2% Recognized: ≤ 0.7% Acceptable: ≤ 2.0% |
| Mobility Adjustment (Accountability Subset) |
District ratings: results for students enrolled in the district in the fall and tested in the same district. Campus ratings: results for students enrolled in the campus in the fall and tested in the same campus. |
None |
None |
|
| Subjects |
- Reading/ELA |
- Reading |
n/a |
n/a |
| Student Groups |
All Students & Student Groups: - African American |
All Students Only |
All Students & Student Groups: - African American |
All Students & Student Groups: - African American |
| Minimum Size Criteria |
||||
| All |
No minimum size requirement; special analysis for small numbers |
30 or more tests |
≥
10 dropouts |
≥
10 dropouts |
| Groups |
30/10%/50 |
n/a |
≥
10 dropouts |
≥
10 dropouts |
| Required Improvement (RI) |
||||
| Actual Change |
2004 minus
2003 performance |
2004 minus 2003 performance |
Class of 2003 rate minus Class of 2002 rate |
2002-03 rate minus 2001-02 rate |
| RI |
Gain needed to reach subject standard (70%, 50%, 35%, 25%) in 2 yrs. |
Gain needed to reach standard (70%, 50%) in 2 yrs. |
Gain needed to reach 75.0% in 2 yrs. |
Decline needed to reach 2.0% in 2 yrs. |
| Use |
Gate up to Acceptable and Recognized |
Gate up to Acceptable and Recognized |
Gate up to Acceptable |
Gate up to Acceptable |
| Floor |
For Recognized – at least 65% |
For Recognized – at least 65% |
none |
none |
| Minimum Size |
Meets minimum size in current year and has ≥ 10 students tested in prior year. |
Meets minimum size in current year and has ≥ 10 tests in prior year. |
Meets minimum size in current year and has ≥ 10 students in completion class the prior year. |
Meets minimum size in current year & has ≥ 10 7th-8th grade students the prior year. |
| Exceptions |
After application of RI, this provision may be applied if the campus or district would be Unacceptable solely due to not meeting the Acceptable criteria on up to 3 assessment measures. Applies to 26 measures - 25 TAKS (5 subjects x 5 groups) plus the SDAA measure. |
n/a |
n/a |
|
| Use |
As a gate up to Acceptable |
n/a |
n/a |
|
| Floor |
No more than 5 percentage points below Acceptable standard. |
n/a |
n/a |
|
| Number of Exceptions Allowed (variable) |
Number of Assessment Measures Evaluated (at campus or district) and Maximum Exceptions Allowed.
|
n/a |
n/a |
|
Accountability 2004 | Accountability | Performance Reporting | TEA Home