|
Texas Assessment of Academic SkillsThe Texas Assessment of Academic Skills (TAAS) program is a state-administered criterion- referenced testing program that draws its objectives from the state-mandated curriculum established by the State Board of Education. Begun in 1990-91, the TAAS emphasizes the assessment of academic skills and focuses on students' higher order thinking and problem-solving skills. A major rewrite of the curriculum, the Texas Essential Knowledge and Skills (TEKS), was completed in the summer of 1997 and the alignment of the TEKS with the TAAS began with the 1998-99 school year. The spring 1999 TAAS tested only skills common to both the TEKS and the essential elements, the curriculum guidelines in place prior to the TEKS. In 1999-2000, those skills found in the TEKS but not previously tested on TAAS will be integrated into the TAAS. Since 1994, the TAAS reading and mathematics assessments have been administered at grades 3-8, and 10 (exit-level) and the writing assessment has been administered at grades 4, 8, and 10. The TAAS program also includes a science and social studies component, given in grade 8. End-of-course examinations are administered to students upon completion of Biology, Algebra I, English II and US History. As an alternative to the 10th grade exit-level test, students may meet their testing requirement for graduation by passing the end-of-course examinations for both Algebra I and English II, plus either US History or Biology. While various measures can be used to interpret test results, this document focuses on the percent passing, computed as the number of students passing a test divided by the number of students taking that test. The percent passing all tests taken is the number of students passing all the tests they attempted, divided by the number of students tested. Generally, results reported in this publication are the percent of students passing tests in the subject areas of reading, writing and mathematics, by grade or summed across grades 3-8, and 10. Where the reported outcomes are the percent of students passing all tests taken, the results include reading, writing and mathematics at grades 4, 8, and 10, and reading and mathematics only at grades 3, 5, 6, and 7. Note that for grade 8, science and social studies results are excluded from the "all tests taken" calculations reported here. TAAS results reported here are those used in the 1999 statewide accountability system. These are results for students served in both regular and special education, and those taking the reading and mathematics Spanish version of TAAS in grades 3 and 4. To allow for valid comparisons to 1999, the 1998 TAAS results reported in this publication have been recomputed to include the performance of students served in both regular and special education, and students taking the reading and mathematics Spanish version of TAAS in grades 3 and 4. Therefore, the 1998 TAAS results reported in this publication will not match those reported in last year's edition of Snapshot. For both 1998 and 1999, an adjustment for mobility is made by including only those examinees enrolled in the district at the end of October of the school year being reported. In 1999 for the first time, students eligible to take the spring exit-level TAAS at grade 10 may have chosen not to take the test if they had already met their testing requirement for graduation by passing end-of-course examinations prior to the spring 1999 administration of the exit-level test. Students in this category were credited as grade 10 passers in calculating district and school passing rates for accountability rating purposes. These TAAS results were reported in the 1999 data tables for accountability, the 1998-99 Academic Excellence Indicator System (AEIS), the 1998-99 School Report Card, and Pocket Edition: 1998-99 Texas Public School Statistics. Readers wishing to review TAAS results for all students tested should request the TEA publication, Texas Assessment of Academic Skills: Student Performance Results, 1998-99, or visit the Texas Education Agency's web site at http://www.tea.state.tx.us/student.assessment. Over 1.75 million of the 1.86 million students who were tested during the spring semester of 1999 in grades 3-8, and 10 are included the accountability results. Reading and mathematics tests were given at all these grades. Over 690,000 students took the writing test statewide in grades 4, 8, and 10. Science and social studies tests were administered to over 245,000 students in grade 8. During 1998-99, end-of-course examinations were administered to over 260,000 Biology students in grades 9-12, and to over 300,000 Algebra I students in grades 7-12. In grades 9-12, over 230,000 students took the English II end-of-course examination, and over 200,000 high school students took the US History end-of-course examination. Exhibit 10 below shows spring 1999 TAAS results by grade and subject. Among the subjects tested, the percent passing is highest for writing, followed by reading and then mathematics; a pattern that has held for the past six years.
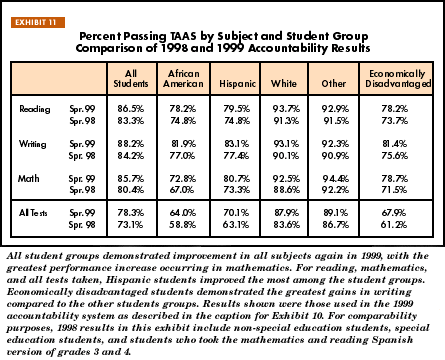
The lowest pass rates by subject and grade are: the Spanish version of reading in grade 4 (46.1) and the Spanish version of mathematics in grade 4 (72.7). The highest pass rates by subject and grade are: reading (English version) in grade 4 (88.8) and grade 10 (88.8), mathematics in grade 5 (90.1), and writing in grade 10 (90.6). Statewide in 1999, 78.3 percent of the students in all grades tested passed all the tests they took. This is an improvement of 5.2 percentage points over the spring of 1998 when 73.1 percent of the students passed all tests taken. Note that this comparison is based on 1999 and 1998 accountability results which include additional students in both years,i.e.,students served in special education and students taking the reading and mathematics Spanish version of TAAS in grades 3 and 4, in addition to regular education students. The results also include, as passers, the 1,892 students who met the testing requirement for graduation by passing end-of-course examinations by the time of their 10th grade exit-level examination in spring 1999, and who did not take the exit-level TAAS. All student groups, as shown in Exhibit 11 below, show performance gains in all subjects. For the fifth consecutive year, the greatest gains in performance occurred in mathematics. Exhibit 11 shows that performance in mathematics improved from 80.4 percent passing in 1998 to 85.7 percent passing in 1999.
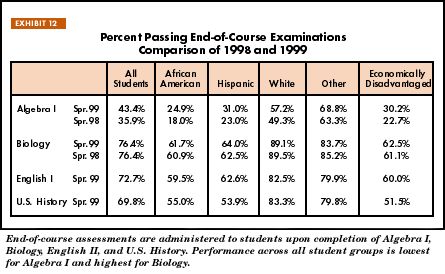
Increases among the student groups ranged from 2.2 percentage points for "other" (Asian/ Pacific Islander and Native American) students, to 7.4 percentage points for Hispanic students. Economically disadvantaged students improved in mathematics by 7.2 percentage points while African American students improved by 5.8 percentage points. Writing results increased by 4.0 percentage points over 1998, from 84.2 to 88.2 percent passing. Reading increased 3.2 points, from 83.3 percent passing in 1998 to 86.5 percent in 1999. Hispanic students achieved the greatest percentage point gains among the student groups in reading (4.7), while economically disadvantaged students did so in writing (5.8). By law, districts must offer remediation to students failing to pass a test in a subject area. Statewide, in grades 3-8 and 10, over 380,000 students (21.7 percent) required remediation after the 1999 TAAS administrations. The state compensatory allotment supports this remediation, although it is allocated to districts based on counts of economically disadvantaged students, not the number of students requiring these services. Students failing to pass the exit-level test or not passing the appropriate combination of end-of-course examinations are not eligible to receive a Texas high school diploma. However, since 1997 local school districts in Texas have had the option to offer certificates of completion for these students if they have met all other graduation requirements. Among sophomores taking the March 1999 TAAS exit-level test, over 53,000 (23.8 percent) failed one or more of the subject areas. These students will have seven more opportunities to master the exit-level TAAS test before the end of their senior year as the class of 2001. Beginning with the class of 1996, a measure of the cumulative pass rate on the exit-level test has been reported in the Academic Excellence Indicator System. Results for the class of 1999 are based on the percent of students who first took the exit-level test in the spring of 1997 and finished testing in the same school district by May 1999. Results for this measure are directly comparable to cumulative pass rates reported in editions of Snapshot from 1995-96 to date, but are not comparable to the proxy measures reported in previous editions. Statewide results indicate that 22,288 students expected to graduate with the class of 1999 have not passed one or more sections of the exit-level TAAS test. This represents an estimated cumulative passing rate of 90.0 percent for the class of 1999 and an improvement over the cumulative passing rate of 88.7 percent for the class of 1998. District-level passing rates for science and social studies are not provided in this publication. Statewide results for 1999 show that 87.1 percent of 8th grade students passed the science assessment and 70.1 percent passed social studies. Performance patterns among student groups on both these tests were similar to those for reading, writing, and mathematics. District-level passing rates for end-of-course examinations are not provided in this publication: however, statewide results for end-of-course examinations are shown in Exhibit 12 below. Two years of results are provided for Algebra I and Biology and one year is provided for English II and US History. As shown in the exhibit, the lowest percent passing among the subjects was for Algebra I.
Although the
passing rate improved from 35.9 percent in 1998 to 43.4 percent in 1999,
the results clearly indicate that much improvement is need in this area,
across all student groups. Changes in statute, resulting from the legislative
session in 1999, mandate that a new exit-level test be created and administered
to 11th graders beginning in 2003. In order to graduate, students will
be required to pass assessments in four subject areas: mathematics,
English language arts, social studies and science. The statute specifies
that the assessments are to test content in Algebra I, Geometry, English
III, Early American and US History, Biology, and Integrated Chemistry
and Physics. Results for end-of-course assessments are currently our
best predictor of performance on the future 11th grade exit-level test.
As shown in Exhibit 12 above,
the 1999 end-of-course results indicate that many students in Texas
are not currently prepared to meet this more stringent exit-level requirement.
For more details on the results of the science and social students assessments,
as well as for the end-of-course examinations, see the publication,
Texas Assessment of Academic Skills: Student Performance Results,
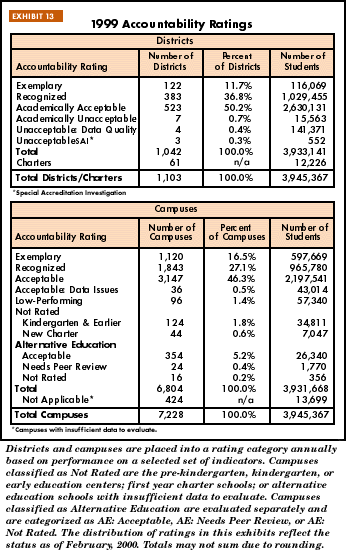
1998-1999 or visit http://www.tea.state.tx.us/ Accountability Rating System for Texas Public SchoolsSince 1994, ratings for Texas public schools and school districts have been based on a consistent set of mandated indicators. These indicators are performance on the reading, writing, and mathematics portions of the TAAS; dropout rates; and attendance rates. As required by statute, overall performance of all students as well as the performance of student groups (African American, Hispanic, White, and Economically Disadvantaged) is evaluated. Student groups must meet minimum size requirements to be included in the evaluation. In 1999, districts could receive a rating of Exemplary; Recognized; Academically Acceptable; Academically Unacceptable; or Unacceptable: Data Quality. Districts may also be rated as Unacceptable: Special Accreditation Investigation (SAI), for reasons other than student performance. Individual schools are also rated. In 1999, schools could be rated Exemplary; Recognized; Acceptable; Acceptable: Data Issues; Low-Performing; Alternative Education: Acceptable, Alternative Education: Needs Peer Review, or Alternative Education: Not Rated. New in 1999, a district rating of Unacceptable: Data Quality and a school rating of Acceptable: Data Issues could be assigned based on poor quality of data reporting. All ratings of this type in 1999 were based on systematically poor, or suspect, dropout data. Districts and schools were also evaluated on three measures for which they could receive additional acknowledgment. These measures, which do not affect the rating for a school or district, are the results of college admissions participation and performance, the percent of students meeting the TAAS/TASP equivalency, and Comparable Improvement (see Endnotes for brief descriptions of these latter two measures). Specific details regarding how accountability ratings and additional acknowledgments were calculated are contained in the Accountability Manual: The 1999 Accountability Rating System for Texas Public Schools and School Districts, which is accessible through the agency's web site. The distributions of district and school ratings for 1999 are shown in Exhibit 13 below. State-level rewards and sanctions are linked to these rating categories.
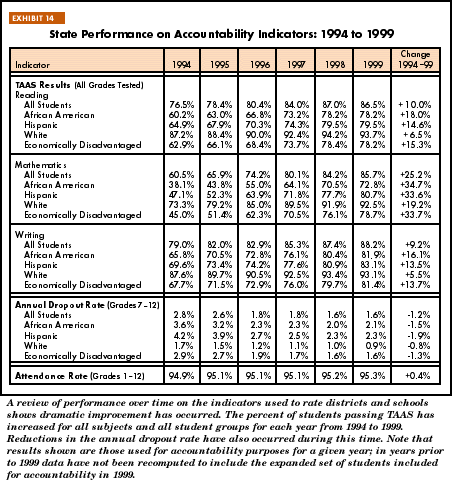
In 1999, almost half (48.5 percent) of the districts achieved either Exemplary or Recognized status, the categories with the highest performance standards. Slightly over half (50.2 percent) of Texas districts were rated Academically Acceptable and the remainder were rated either Academically Unacceptable (0.7 percent, or 7 districts); Unacceptable: SAI (0.3 percent); or Unacceptable: Data Quality (0.4 percent). In 1999, 1,120 schools were rated Exemplary. This is an increase of 72 schools over the number rated Exemplary in 1998. The number of Low- Performing schools increased from 59 in 1998 to 96 in 1999. Of the 96 schools rated Low- Performing in 1999, 62 received this rating due to poor performance on TAAS, (30 on mathematics, five on reading, 18 on writing and nine on a combination of subjects); 21 received the rating due to a high dropout rate; eight received it as result of data issues; and the remaining five received the rating due to a combination of a high dropout rate and poor performance on TAAS. The increase in the number of schools rated Low-Performing was due to two changes in the accountability system in 1999: the standard to be rated Acceptable was raised from 45.0 to 50.0 percent passing on the TAAS measures, and more students were included in evaluations. The latter change increased the number of student groups evaluated in the system. Exhibit 14 below shows the changes in performance on the accountability indicators between 1994 to 1999.
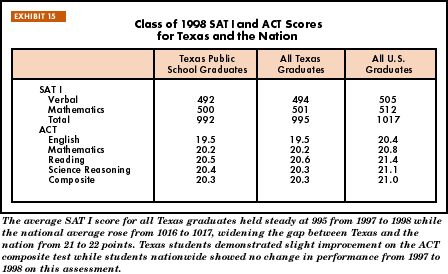
Each year since 1994, the disparities in TAAS performance among the major ethnic groups in Texas have narrowed. This is true for all three subjects, with the most dramatic improvement occurring for minority students passing the mathematics portion of the TAAS. In addition, the dropout rate has declined and the attendance rate has risen slightly over the same period. The statewide accountability system holds districts and schools responsible for student group performance in order to focus attention on the performance of all students and reduce disparities in achievement among the major student groups in Texas. These improvements reflect the concerted efforts of educators, parents, and students statewide to meet the expectations of the accountability system. College Admissions TestsIn Texas, almost 62 percent of public high school graduates in the class of 1998 participated in college admissions testing, a slight decline from the almost 64 percent for the class of 1997. Although the percent declined from 1997 to 1998, the number of students participating in college admissions testing increased. Of the class of 1998, over 110,000 took either the SAT I, the ACT, or both tests, compared to almost 105,000 for the class of 1997. The ACT is the ACT Assessment administered by ACT, Inc. The SAT I is the SAT I: Reasoning Test of the College Board's SAT Program. It is a revised but comparable test that was introduced in March 1994 to replace the Scholastic Aptitude Test. Nationwide, the testing companies report that approximately 43 percent of all graduates took the SAT I and 37 percent took the ACT. In Texas, 51 percent of all graduates took the SAT I, and 32 percent took the ACT. For both Texas and the nation, "all graduates" includes public and nonpublic school students. The SAT I consists of verbal and mathematics components. Scores on the verbal and mathematics sections of the SAT I range from 200 to 800 and sum to the SAT I total score, which ranges from 400 to 1600. The ACT includes tests of reading and science reasoning in addition to English and mathematics. Each subject area component of the ACT has a score ranging from 1 to 36. The composite is the average of these four scores. Beginning with the class of 1996, SAT I scores have been reported on a recentered scale by the College Board. SAT scores reported in editions of Snapshot prior to 1996-97, because they are based on the original scale, cannot be directly compared to recentered scores reported for the class of 1996 and beyond. Exhibit 15 below shows the average SAT I and ACT scores for all graduates for Texas and the nation. In addition, the averages for just the public school graduates in Texas are shown.
SAT I performance held steady while ACT performance rose slightly for all class of 1998 Texas graduates. This occurred even as the numbers tested increased substantially over the past year--up 6.8 percent for the SAT I and 9.7 percent for the ACT in Texas. Nationally, percent increases in the number of SAT I and ACT examinees were 4.1 percent and 3.7 percent, respectively. In Texas, a record number of graduates took one of the two examinations; there were 100,417 SAT I-tested graduates and 64,064 ACT-tested graduates. An additional data element derived from the college admissions testing program is the percentage of public school examinees scoring at or above a specified accountability criterion score (1110 on the SAT I; 24 on the ACT). This standard of excellence was met or exceeded by 27.2 percent of the class of 1998, a slight increase over the 26.6 percent achieved by the class of 1997. Two additional indicators of how well Texas students are prepared for college are reported annually in AEIS reports: the percent of students completing advanced academic courses in grades 9 through 12, and the percent of students completing the SBOE Recommended High School Program. The most recent data available, for the 1997-98 school year, indicate that 18.9 percent of students in grades 9 through 12 completed and received credit for at least one advanced academic course. However, percents varied among the student groups, from 12.6 percent for economically disadvantaged students, to 13.1 percent for African American students, 14.5 percent for Hispanic students, 18.5 percent for Native American, 22.7 percent for White students, and 35.9 percent for Asian/Pacific Islander students. Although the percents increased across all student groups between 1996-97 and 1997-98, these results indicate that more students, and particularly more minority students, should be encouraged to participate in more academically rigorous courses. Statewide, 8.7 percent of the class of 1998 completed the Recommended High School Program or the more rigorous Distinguished Achievement Program. The percent completing these programs ranged across student groups from 4.7 for African American students, to 5.4 for economically disadvantaged, 6.0 for Hispanic, 7.1 for Native American, 10.8 for White, and 15.2 percent for Asian/Pacific Islander students. The class of 1998 was the first class that had the SBOE's Recommended High School and Distinguished Achievement Programs defined for all four years of high school. |


