
Diversity
The 3.9 million public school
students in Texas are served in markedly differing school settings.
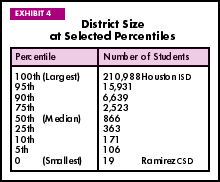
For example, in 1997-98 only 19 students attended school in the Ramirez
Common School District located in South Texas, while over 210,000 students
received instruction at 299 school sites in the Houston Independent
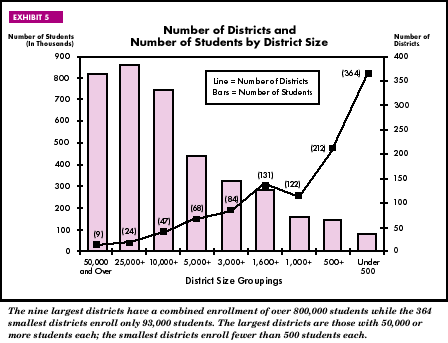
School District, the largest district in the state. The nine largest
districts, those with at least 50,000 students each, serve 21 percent
of all Texas public school students, while the smallest districts (i.e.,
districts with fewer than 500 students each), represent 34 percent of
all districts but enroll only 2.4 percent of the state's students. The
inverse relationship between the number of districts and the number
of enrolled students is a defining characteristic of the Texas public
school system. See Exhibit 4
and Exhibit 5 below.
The ethnic distribution
of students varies greatly across the state and appears to depend in
part on geography, size of the district, and type of community served.
Statewide, 55.0 percent of all students are from minority ethnic groups.
A minority student is defined as a member of either the African American,
Hispanic, Native American, or Asian/Pacific Islander ethnic groups.
Districts in major urban areas serve an 80.8 percent minority student
population while districts in rural areas serve a population that is
only 33.0 percent minority.
By far the largest minority
student group within the state is the Hispanic student population, which
represents 37.9 percent of all students. The highest percentages of
Hispanic students are found in the Edinburg ESC region at the southernmost
tip of the state (94.9 percent), and in the El Paso region in far west
Texas (83.7 percent). The largest percentage of African American students,
30.7 percent, is in the Beaumont region, east of Houston. The eastern,
northern, and north central parts of the state have the highest percentages
of White students, varying between 61.5 and 75.4 percent in these areas.
The proportion of students
from homes experiencing economic hardship also varies across the state.
Although the state of Texas does not levy personal income taxes and
has little information about family earnings, student eligibility to
participate in the national free or reduced-price lunch program is one
indicator of student economic status. Districts report that 48.5 percent
of Texas public schoolchildren were eligible to participate in this
program for the 1997-98 school year. Higher concentrations of economically
disadvantaged students are found in major urban districts and in districts
with high percentages of minority students. The lowest percentages of
economically disadvantaged students can be found in districts considered
to be non-metro "fast growing" and in districts that are suburban
to major urban areas. Generally speaking, districts with lower property
wealth have higher percentages of economically disadvantaged students.
Student participation in
special instructional programs differs by community type, district size,
and geographic location. For example, a greater percentage of students
in rural districts enroll in career and technology courses--25.5 percent
compared with 14.9 percent in major urban districts. The 19 charters,
however, have the highest percentage of students participating in career
and technology courses, 37.3 percent. The highest percentages of students
served in bilingual or English as a second language (ESL) programs are
enrolled in the Edinburg and El Paso service center regions, with 37.2
percent and 25.2 percent, respectively. These figures are well above
the state average of 11.9 percent for those programs. The largest districts
also report above average percentages in bilingual or English as a second
language (ESL) programs.
The number of students who
participate in special education programs grew by 0.4 percent in 1997-98.
In this year, districts identified 466,527 students, or 12.0 percent
of all students, as receiving some type of special education service.
There is little variation in the percent of special education students
served across the various district grouping categories. The larger and
more urban districts tend to show slightly lower percentages of special
education students among their total student population than the smaller,
rural districts do.
Student Population
Growth
In 1997-98, public schools
in Texas served 3,891,877 students in pre-kindergarten through grade
12. This total student count represents a 1.6 percent increase from
the prior year, which is a smaller rate of increase than the 2.4 percent
growth the state experienced between 1995-96 and 1996-97. Membership
in the 19 charters was 3,856, an increase of nearly 60 percent compared
with the 1996-97 charter enrollment of 2,412 students. The number of
charters in operation only increased by three (16 to 19) between 1996-97
and 1997-98, but the average school size increased from 151 to 203 students
per charter.
Of all students enrolled
for the 1997-98 school year, nearly 86 percent were served the previous
year and the remaining 14 percent were newly enrolled students. This
14 percent includes students entering school for the first time (e.g.,
pre-kindergarten and kindergarten enrollees) as well as students entering
the Texas public education system from other sources, such as private
schools or residents new to the state. This new student percentage is
a decline of three percentage points from the 17 percent reported five
years ago in 1992-93 as newly enrolled.
While the majority of districts
continue to show enrollment increases, compared to last year, the percentage
of districts experiencing growth is smaller. For 1997-98, 60.3 percent
of districts reported enrollment growth while 68.6 percent reported
increases in 1996-97. Districts located in areas that are suburban to
major urban districts continue to demonstrate higher than average growth.
Compared to the state average of 1.6 percent, the 62 "major suburban"
districts experienced a 3.1 percent enrollment increase from the prior
year. In contrast, rural districts as a group only increased 0.2 percent
in size from the prior year.
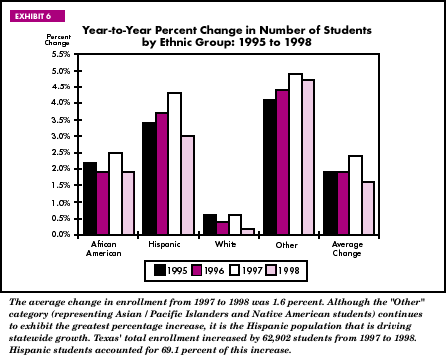
As shown in Exhibit
6 below, growth in the minority student population continues
to exceed non-minority growth. Minority students now comprise 55.0 percent
of the public school population, compared with 54.4 percent in 1996-97.
Overall, growth in the minority student population was 2.8 percent,
with the greatest increase, 4.7 percent, occurring in the Asian/Pacific
Islander and Native American populations. However, these two populations,
categorized in this document as a single group labeled "other,"
account for only 2.7 percent of all students.
The number of African American
students grew by 1.9 percent, representing a net increase of 10,690
students, which is smaller than the increase of 13,230 experienced last
year. African Americans comprise 14.4 percent of the total public school
population in 1997-98 compared to 14.3 percent in 1996-97. Although
the increase in African American student numbers was smaller than the
year before, the percentage of African American students within the
state increased for the first time since 1991-92.
The Hispanic student growth
rate, 3.0 percent, is smaller than last year's growth rate of 4.3 percent.
Although this rate of growth is not the highest among the ethnic groups,
it is the most significant. The Hispanic student population continues
to drive statewide growth. Of the 62,902 student increase in Texas'
total enrollment, 69.1 percent, or 43,462 students were Hispanic. This
population now accounts for 37.9 percent of the total number of students.
In contrast, the White population
grew by only 0.2 percent, or by 4,001 students. This rate of increase
is the smallest among all the ethnic groups. The percentage of White
students statewide has dropped from 49.0 percent six years ago to 45.0
percent this year. The reduction in the percent of White students in
the total student population over the last several years is attributable
to the increasing growth rates of minority students relative to the
growth for the White student population.
Growth by Grade
At the state level, all
grades except grade 6 reported some growth for the 1997-98 school year.
As in 1996-97, grades 11 and 12 demonstrated some of the highest rates
of growth. Grade 11 grew 3.7 percent, contributing a gain of 8,243 students
and grade 12 experienced a rate of growth over 6.0 percent, with an
increase of 11,853 students. The 6th grade state total enrollment decreased
by 120 students to 297,957, a 0.04 percent decline.
By far the largest number
of students new to the Texas public schools are children entering pre-kindergarten
and kindergarten. Over 291,000 students entered public schools at these
two grade levels in 1997-98, which represents 52.2 percent of all new
students. Other than pre-kindergarten and kindergarten, grades 1 and
9 also have a large percentage of new students. Almost 12 percent of
all 1st graders and nearly 10 percent of all 9th graders are students
who were not enrolled in Texas public schools the prior year. These
grades are traditional entry points for students previously enrolled
in private schools.
On average, pre-kindergarten
and kindergarten have higher percentages of minority students, 64.7
percent, than the total student population (55.0 percent). Statutory
requirements for pre-kindergarten education stipulate that limited English-proficient
(LEP) or economically disadvantaged pupils are among those who must
be identified and served in pre-kindergarten. These student characteristics
are highly correlated with ethnicity in Texas. In grades 1 through 5,
the ethnic distribution remains very similar to the state averages,
while the secondary grades (grades 6-12) have slightly more White students,
47.8 percent compared with 45.0 percent statewide.
Dropouts
Data for students who drop
out of Texas public schools are collected in the fall following the
year the students left school. Thus, dropout data reported in the 1997-98
edition of Snapshot reflect students who dropped out during
the 1996-97 school year. During that reporting period--August 1996 through
October 1997--26,901 students in grades 7-12 dropped out of Texas public
schools. This is a decline of 2,306 dropouts from the previous year.
The annual dropout rate for 1996-97 is 1.6 percent; 0.2 percent less
than the dropout rate reported for 1995-96.
Both the Hispanic and African
American student groups continue to be disproportionately represented
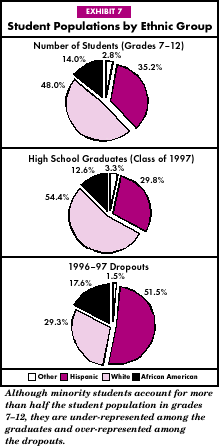
among dropouts. As shown in Exhibit 7
below, 69.1 percent of all dropouts are either Hispanic or African American.
Overall, the percent of total dropouts who are minorities increased
slightly to 70.7 percent, compared with 70.4 percent in 1995-96. Furthermore,
dropout rates for both Hispanic and African American students remain
higher than the state average of 1.6 percent. The Hispanic and African
American annual rates were 2.3 percent and 2.0 percent, respectively.
The dropout rate for Asian/Pacific Islanders and Native Americans combined
was 0.9 percent, and White students had a dropout rate of 1.0 percent.
Since dropout information has
been collected in Texas, Hispanic and African American students have
consistently exhibited the greatest dropout rates among all the ethnic
groups. However, the gap between the White and nonwhite dropout rates
has diminished over time. In 1987-88 the difference between dropout
rates for minority and White students was 3.4 percentage points. This
difference has closed to 1.1 percentage points in 1996-97. While this
represents improvement, there is no doubt that minority and economically
disadvantaged students are not completing high school as often as are
their White and non-economically disadvantaged peers.
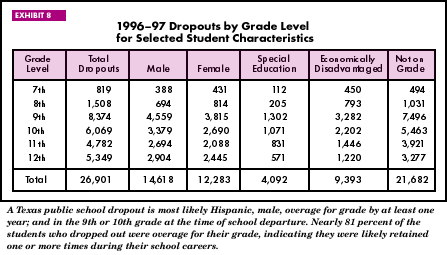
The 12th grade dropout rate
was highest, at 2.5 percent, followed by a rate of 2.3 percent for 9th
graders. In terms of raw numbers, however, more students drop out in
9th grade, 8,374 versus 5,349 in 12th grade. The 1996-97 dropout rates
reported for 10th and 11th graders were 2.2 percent and 2.1 percent,
respectively.
Nearly 35 percent of all
dropouts are identified as economically disadvantaged, and a remarkable
80.6 percent are overage for their grade. Consistent with data reported
over the last nine years, more males than females dropped out during
1996-97 (54.3 percent versus 45.7 percent). See Exhibit
8 below.
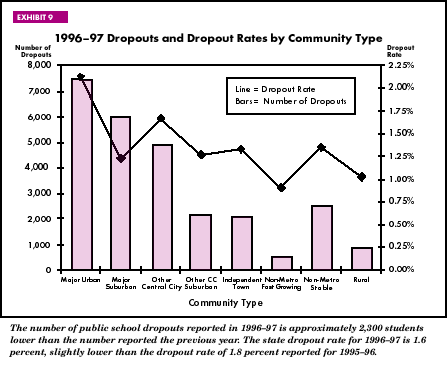
Urban districts and districts
with high percentages of minority students have the highest dropout
rates. Exhibit 9 below, depicts
the relationship between community type and dropout rates. Both minority
students and economically disadvantaged students are found in greater
numbers in urban areas, which may partially explain why these rates
are higher than average.
As a group, districts with
the greatest student enrollment--those in urban areas--have consistently
reported greater dropout rates than smaller districts. However, the
relationship between dropout rates and campus size does not show the
same pattern. Among campuses, the dropout rate for the smallest schools
(those with fewer than 200 students) is the greatest-a dropout rate
of 5.8 percent. Analysis reveals that only 12.2 percent of these small
schools with dropouts are in rural areas. The remainder are small campuses
located in urban settings which appear to be specifically designed to
serve students at greater risk of dropping out.
Graduates
As with the dropout data,
information for graduates of Texas public schools is collected in the
fall following the year of graduation. During the 1996-97 school year,
181,794 seniors graduated as the class of 1997 from Texas public schools.
This count is an increase of 5.8 percent over the class of 1996 graduates.
Of the class of 1997 graduates, 16,825 were identified as special education
students. Statewide, White students accounted for 54.4 percent of all
graduates, Hispanic students 29.8 percent, African American students
12.6 percent, and Asian/Pacific Islander and Native American students
the remaining 3.3 percent. See Exhibit 7
above, for a disaggregation of the ethnic groups for the 7th-12th grade
student population, graduates, and dropouts.
Students in Texas public
schools who exceed the minimum graduation requirements may graduate
with an "Advanced," "Advanced with Honors," "Recommended
High School Program," or "Distinguished Achievement Program"
diploma type. The requirements for each type are defined by the SBOE.
For the class of 1997, graduates with either of the "Advanced"
seals totaled 71,602, an increase of 3.9 percent from the prior graduating
class. The number of students graduating under the Recommended High
School/Distinguished Achievement Programs was 2,495 for the class of
1997, an increase of nearly 206 percent from the graduating class of
1996. The rapid rate of increase in diplomas of these latter two types
is due to the small numbers reported and to the fact that these programs
are still less than four years old. The class of 1998 will be the first
graduating class for which the Recommended High School Program/Distinguished
Achievement Program requirements were in place since the 9th grade year.
Counts of participants in these programs are expected to increase dramatically
over the next few years, as the older "Advanced" and "Advanced
with Honors" diploma types are phased out.
|