|
| Total Student Population |
5,385,012 |
Total Student Population who are
Economically Disadvantaged |
3,164,349 (58.8%) |
| English Learners |
1,014,830 (18.8%) |
| Served by Special Education Programs |
488,463 (9.1%) |
| Unschooled Asylees or Refugees |
4,361 (0.1%) |
|
|
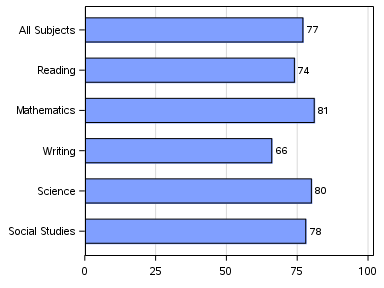
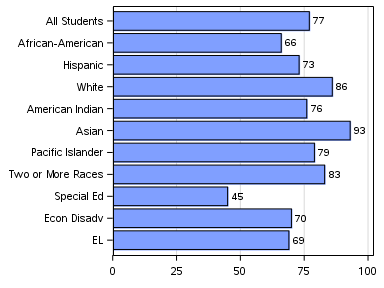
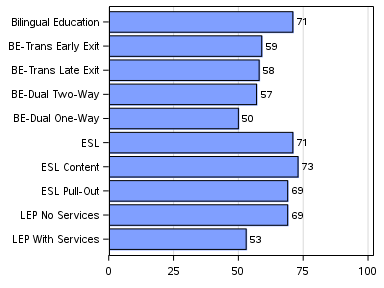
2018 STAAR Passing Rate
(Percent at Approaches Grade Level or Above) |
|
|
|
| For student groups or special language programs with fewer than five students, the STAAR passing rates are not shown on the bar graph to protect student confidentiality. |
|